Currency pair correlation, table and indicator for calculating the indicator
Many people often hear the assertion that exchange rates are strongly correlated. However, there are virtually no clear practical recommendations on how to apply this knowledge in practice. 
To understand this, it's important to consider the concept of a correction coefficient.
The correlation of currency pairs is a ratio or interrelationship. For traders and investors, this concept refers to the coefficient of interdependence of financial assets.
This indicator is very often used in many trading strategies, and it should be noted that there is a connection not only between exchange rates, but also a stable correlation between assets included in different groups.
The most striking example of correlation at the moment is the dependence of cryptocurrency rates: when the price of Bitcoin changes, the rates of other cryptocurrencies begin to change almost immediately.
It is known that all currency pairs are to a certain extent dependent on each other, since they often include the same assets or are influenced by similar factors.
Forex currency pair correlation table
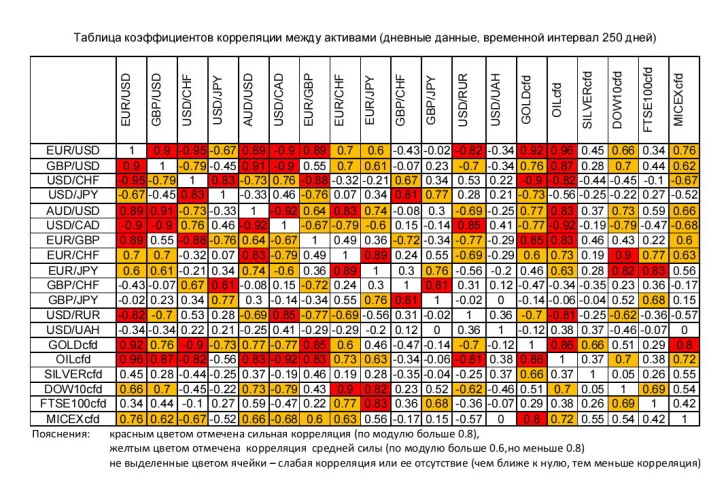 The table presents a list of the most liquid financial instruments.
The level of correlation is expressed numerically: 1 means absolute coincidence of price fluctuations, while -1 means the opposite.
Several strategies based on this correlation can be found online. The core idea behind most of them is that some highly correlated assets lag slightly.
Such assumptions are absurd, and if you understand the fundamental principles and structure of financial markets, this becomes obvious.
How to use the currency pair correlation coefficient
It's important to understand that currency is practically the most sought-after asset. Significant buying and selling volumes trigger high volatility, which in turn leads to market noise.
All existing analytical tools were developed during the 20th century and were used exclusively to determine the dynamics of stock asset prices.
Stocks and government bonds are easier to predict than national currencies, whose current price depends more on volumes and the psychological sentiment of major trading participants than on macroeconomic indicators.

The NYSE is the largest trading platform, whose index is calculated using the average value of US companies' stocks.
This index effectively reflects the current state of the US economy. This allows one to assess the psychology of market makers and apply this knowledge to Forex trading. It's important to know that a positive trend in stock markets attracts investment, while a negative trend leads to increased investment in government bonds, which strengthens the national currency.
The correlation coefficient between NYSE charts and currency pairs with the USD as the numerator averages -0.87. In other words, the stock index chart is constructed inversely to the aforementioned instruments.
 The relationship between the NYSE index and the USD/CHF currency pair chart.
Stock indices are easier to predict using candlestick and technical analysis, and the results obtained should be applied to currency pair trading.
For example, if a pin bar forms on the NYSE locally, indicating a trend reversal from up to down, a By order should be opened on the USD/CAD chart.
In this case, placing safety orders is inappropriate. The trade should be closed at the current price at the close of trading on the US stock exchange.
The necessary tools for the practical application of this tactic can be found in the following articles:
- Currency Pair Correlation Indicator - http://time-forex.com/indikators/indikator-korrelycii
- Correlation Strategy - http://time-forex.com/strategy/strategiy-korrelycyy
When used correctly, currency pair correlation can significantly improve your trading results.

