Analysis of completed transactions
When studying stock market literature, almost every author devotes an entire section  of the book to self-analysis. The fact is, all of our work in the financial markets is, in one way or another, connected to self-analysis.
Moreover, before we begin trading, we analyze our trading strategy for a specific instrument, then conduct an analysis of various capital management models, and then actually analyze the transactions we've made to identify all the positive and negative aspects of our chosen trading tactics.
Analysis of completed transactions is the final step, during which conclusions can be drawn about the chosen trading tactics and certain adjustments can be made.
Essentially, by analyzing our trades historically, we learn from our mistakes, preventing us from making the same mistakes in the future. However, analyzing past trades is far from easy, as identifying weaknesses in a strategy requires hours of valuable time.
To make our lives as easy as possible, I suggest using the "Trading Operations Analysis" program, which will allow you to create a comprehensive report on your trading strategy, see the profitability of each currency pair in a multi-currency trading strategy, and much more.
Installing the application
Before exploring the app's features, I recommend downloading it at the end of this article. Since the program works exclusively with your trade history, you'll need to install the special "save_hist" script, which is also included in the program archive, to collect data.
To do this, log into the trading terminal where you've accumulated your trade history and open the data directory using the File menu. Next, place "save_hist" in the Scripts folder and update the data in the Navigator panel. To have the script compile your trade history into the required format for the program, simply drag it onto the chart of any currency pair:
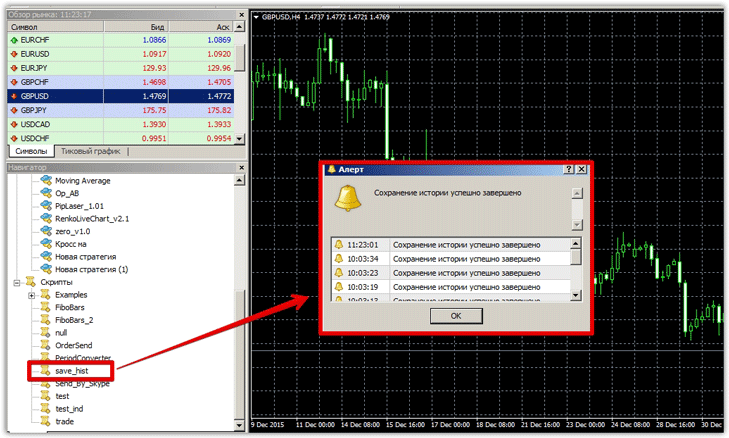 After you've saved the history, launch the program and click "Import" in the File menu. Run the file the script saved earlier. If you're having trouble finding the saved file, you can find it in your terminal directory, in a folder called "File.".
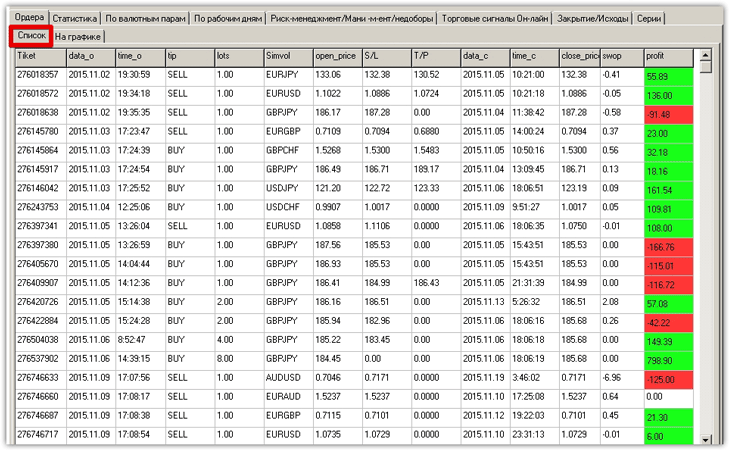
If you've done everything correctly, all your trades will be displayed in the "List" tab of the program, and they will be immediately sorted and marked as profitable or unprofitable.
Working with the program
The first step is to review your trading statistics. To do this, go to the "Statistics" tab, enter your initial deposit, and click "Calculate." Since we were experimenting with a multi-currency trading strategy, we uploaded our history.
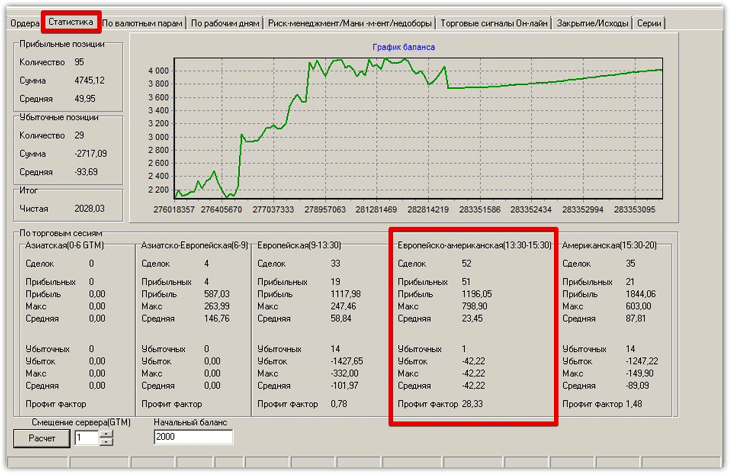 So, the first thing we can see in the "Statistics" tab is the number of trades, the total amount of profitable trades, the average profitable trade, the number of losing positions, the amount of losing positions, the average losing trade, and the net profit.
The program also visually displays a balance graph, and when compared with MT4, it appeared identical. Working with this type of program, I first encountered trade analysis based on trading sessions. The program clearly displays the number of trades in a given trading session, the number of profitable ones, and their profit factor.
After analyzing my report, I found out that during the European-American trading session, the trading strategy we were experimenting with showed the highest profit factor, while the Asian and purely European trading sessions are an unsuccessful period for the strategy.
This analysis will help you avoid many mistakes and choose the optimal trading time for your trading strategy.
The next step is to check the strategy's profitability based on the currency pair. To do this, go to the "By Currency Pairs" tab and click "Calculate." The program will generate a graph displaying your losses and profits based on the currency pair, with each instrument's graph having a different color.
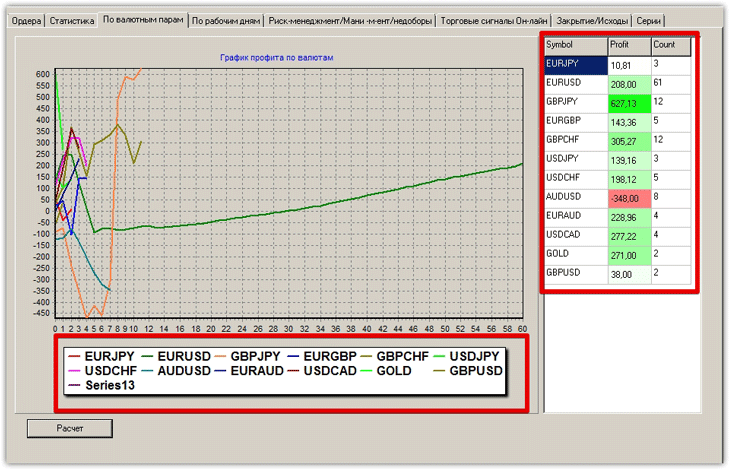 The figure shows how the program clearly identified which currency pairs the strategy was profitable for and which resulted in losses. In our case, it turned out that we suffered only losses on the AUD/USD currency pair, while on the GBP/JPY, we achieved maximum profits.
This program feature is very useful when analyzing the transaction history of multi-currency Expert Advisors or trading strategies, allowing you to discard currency pairs on which your strategy is ineffective.
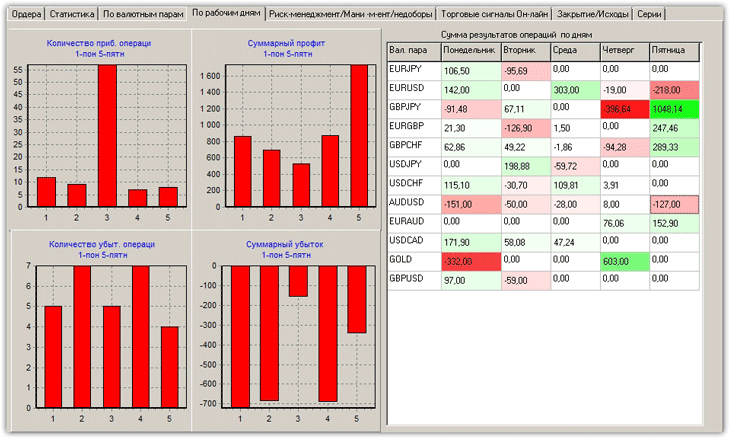
In the "Working Days" tab, you can view the number of profitable and losing trades by day of the week on a chart. The average loss and average profit for each currency pair are also displayed in a table by day. It turns out that Friday was the most profitable day for our GBP/JPY trading strategy.
 Overall, the program allows for a comprehensive analysis of completed trades. In addition to the features discussed in this article, you can view money management statistics, see the number of losing and profitable positions for each instrument, and see the number of trades closed at profit, stop orders, profitable trades closed at stop orders, and much more.

