Trader's trading analyzer
Analyzing completed trades has always helped uncover the strengths and weaknesses  of a trader's trading strategy. Many people overlook this type of analysis, but with experience, you begin to understand that the trade history holds all the necessary answers, allowing you to avoid many mistakes in the future.
The Trade Analyzer is an innovative online service now available to all AMarkets broker clients.
Previously, to analyze transactions and trading in general, it was necessary to spend a lot of time or use additional programs, which in most cases were distributed only on a paid basis.
The broker has divided the service into five main sections: "Monthly Analysis," "Trading Account Monitoring," "Trading Activity," "Deposit Utilization Indicator," and "Recommendations." The "Monthly Analysis" section is particularly useful and worth noting as it offers the most information.
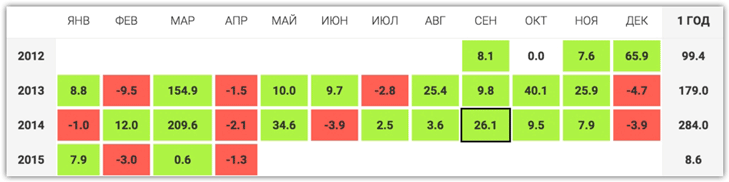
In the "Monthly Analysis" section, you can see the dynamics of your account's development over the entire trading period by month, expressed as a percentage of profit or loss from the deposit.
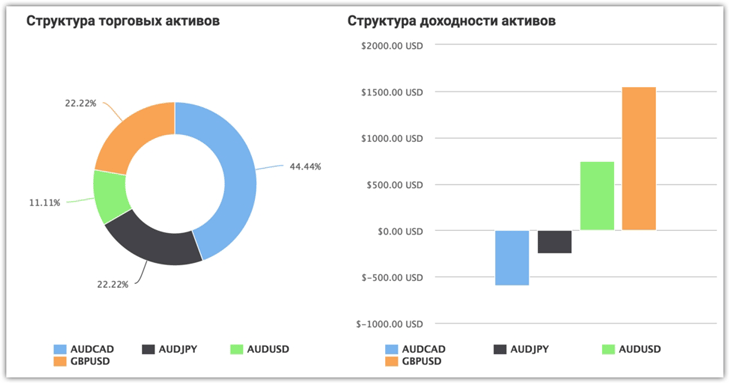
 In this section, you can also view the structure of your trading assets, specifically which instruments you opened positions on as a percentage of the total number of trades, and see the profitability of specific instruments on a chart.
This analysis will allow you to quickly identify the instrument on which you are most often losing money, but which you simply don't notice due to the profits from other trades.
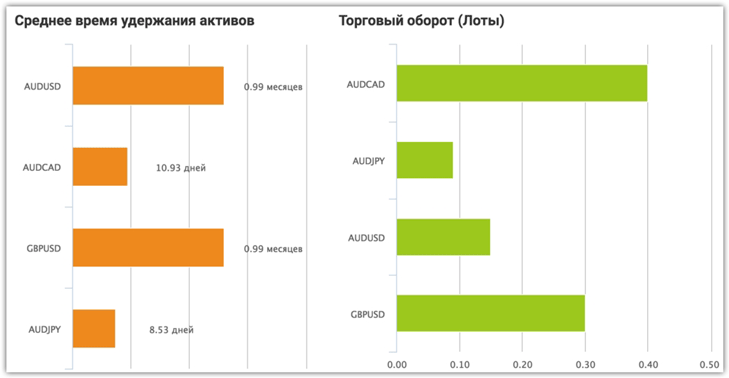
 The trade analyzer displays the average asset holding time, specifically the average time a trade is in the market, as well as the trading turnover in lots for each instrument.
Very often, the cause of unprofitable positions is insufficient holding of a trade in the market and its immediate closure, and information on the average lifespan of a particular trade on a particular instrument will help you immediately see what you are doing wrong in relation to other profitable trades.
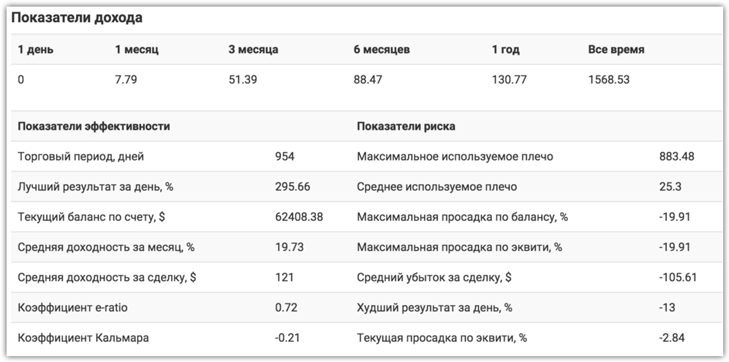
 In the "Trading Account Monitoring" section, you can view information that reflects the performance of your trading, namely risk indicators and performance indicators.
Additional indicators.
In terms of performance indicators, you can find out the Squid Ratio, e-ratio, average return per trade, average monthly return as a percentage, and best daily result.
In relation to risks, the trade analyzer will provide information on the maximum drawdown, maximum drawdown by equity %, maximum leverage used, average leverage, and much more.
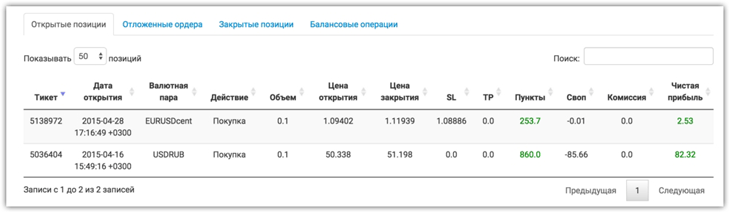
 The "Trading Activity" section stores all your open and closed trades, including pending orders, which the trade analyzer uses as input. This section also makes the analysis process more convenient for traders, as you don't have to open MT4 to view information on closed trades.
 Broker Amarkets has created an excellent visual indicator that allows you to see how your deposit is being used. Its main purpose is to show how risky your trading style is.
If the indicator arrow is in the red or yellow area, you should reduce your trading aggressiveness (work on your money management).
The fifth and final section of the Analyzer is "Recommendations." In this section, the service provides comprehensive recommendations regarding your leverage, drawdowns, the presence or absence of stop orders, and many other parameters where the service detects deviations from the norm.
In general, these types of services can make it easier for traders to correct their mistakes, and a truly honest broker is primarily interested in the success of its clients.
You can find the analyzer itself on the Amarkets page - www.amarkets.org

