Pattern Graphix – an advisor for graphical analysis
Today, it is quite difficult to discuss the importance of graphical analysis, since even the most inveterate critic  knows that this tool has proven its effectiveness over time.
However, graphical analysis is a rather complex approach, despite the principle of constructing figures being clear at first glance.
Would you agree that the head and shoulders in the book look so realistic that you can't tell them apart from a real person? And if you come across something like that at the market once a year, that's no small feat.
Pattern Graphix is an innovation in graphical analysis that allows you to identify various graphical patterns virtually automatically, without any trader intervention. Just think: the program automatically identifies virtually all popular patterns, displays profits and stops just like in books, and all without any intervention on your part.
Thanks to a development from InstaForex, graphical analysis has become accessible even to traders new to this approach, as the Pattern Graphix plugin not only reports this pattern but also visually draws it with detailed recommendations.
Installing Pattern Graphix
Installing Pattern Graphix is fundamentally different from installing indicators or other MT4 components. After downloading and running the installer, an additional window will appear asking you to specify the path to your terminal.
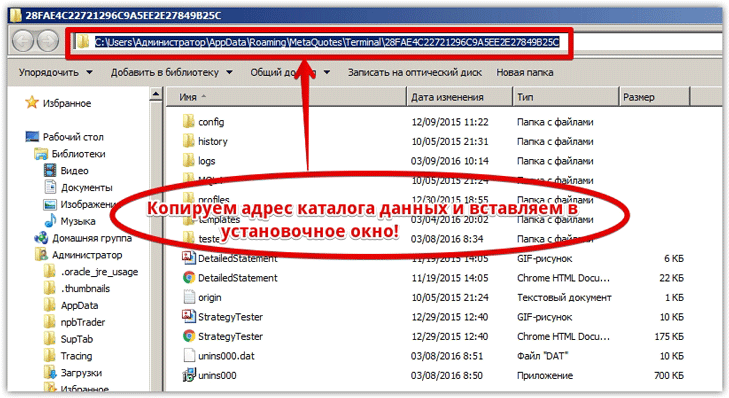
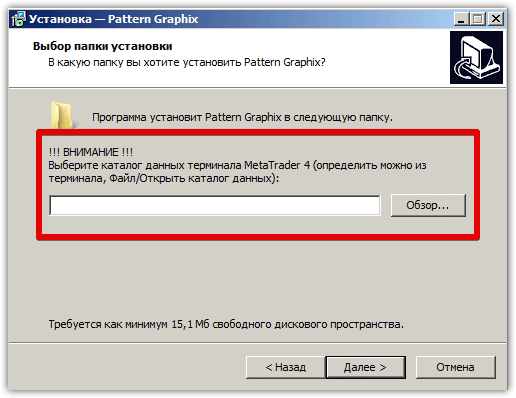 I'd like to point out that the program requires the data directory, not the trading terminal installation location. To find out where to install the program, access the data directory through your terminal's file menu.
Next, in the top address bar, copy the path and paste it into the first window located above, then click Next.
 After this simple installation procedure, Pattern Graphix will appear in the list of advisors, after which you need to drag it onto the chart of the currency pair for which you want to perform graphical analysis.
Pattern Graphix Menu: Turning shapes on or off
To access the Pattern Graphix menu, click on the program logo located directly on the chart. Once clicked, the following menu will appear:
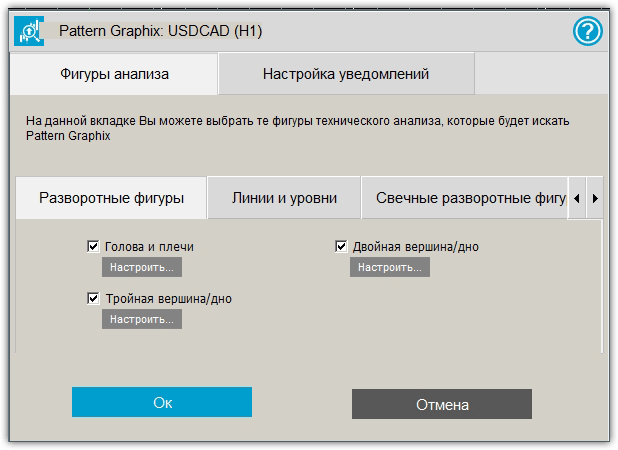 Pattern Graphix allows you to identify reversal patterns, lines and levels, candlestick reversal patterns, and trend continuation patterns. Let's go through each section of the settings and see which specific patterns Pattern Graphix can detect.
Reversal patterns of graphical analysis
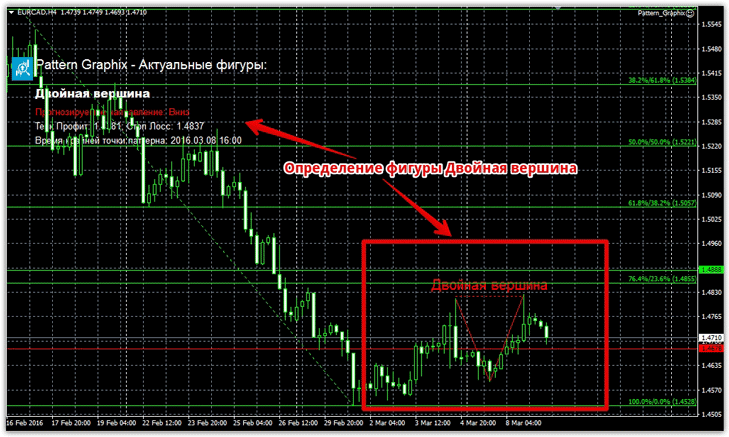
In the settings, you can enable or disable three reversal patterns: head and shoulders, double top/double bottom, and triple top/triple bottom. These reversal patterns are most often used by traders because they allow them to predict a global trend reversal in advance.
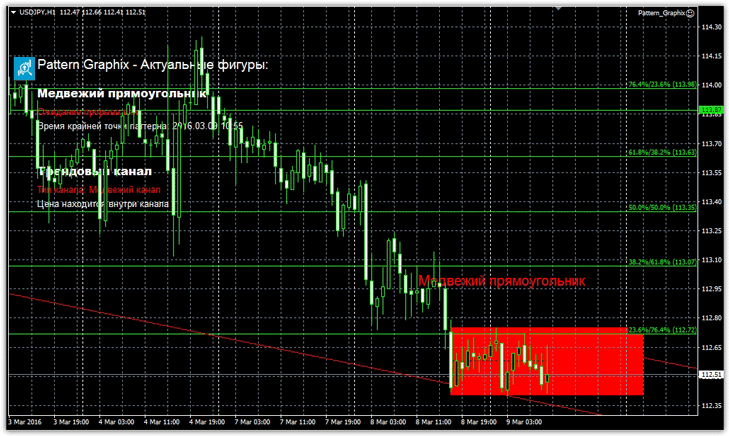
An example of the program's operation using reversal patterns:
Trend continuation patterns
As a trader maintains a long-term position in the direction of the main trend, each pullback is perceived as a reversal, so trend continuation patterns can clearly determine its strength and future direction.
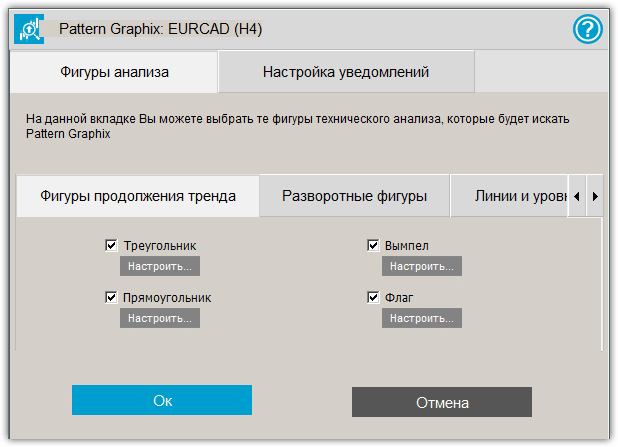 In the Pattern Graphix menu, you can enable or disable four trend continuation patterns: triangle, rectangle, pennant, and flag. Pattern Graphix easily detects all four of these patterns on the chart and reports their presence. An example of a trend continuation pattern is shown below:
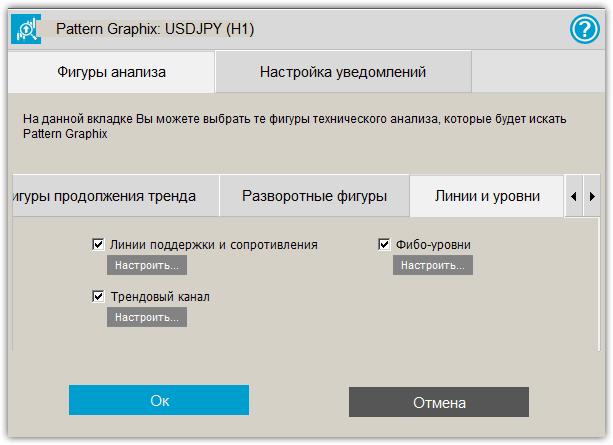
Lines and levels
In addition to recognizing graphical analysis patterns, Pattern Graphix successfully identifies support and resistance levels, plots a price channel and generates signals based on it, and creates a Fibonacci grid and tracks it as the price changes. You can enable or disable all these features in the advisor's settings.
Candlestick reversal patterns
In addition to graphical analysis, Pattern Graphix can perform candlestick analysis and identify reversal candlestick patterns such as Hammer, Engulfing, Hanging Man, and Harami. Candlestick analysis is disabled by default, but you can enable additional features with a simple click in the settings.
In summary, it's safe to say that Pattern Graphix is a unique development that makes life easier for hundreds of traders. The advisor's performance is also noteworthy, as patterns are found in seconds without any load on the terminal.
You can use Pattern Graphix on the broker's website instaforex.com

