False breakout
The fundamental, undeniable law of the market is that price takes levels into account as it moves. 
Yes, whether it's a trader trading on the news or an investment banker at one of the world's largest companies, they all take psychological levels into account.
This very property of price to take levels into account has become the key factor underlying the construction of hundreds of breakout strategies.
It's worth noting that the principle of trading based on levels, regardless of the strategy's content, is virtually identical.
However, using this obvious law in practice is not so straightforward, as in reality, false breakouts are more common than genuine price breakouts.
Consequently, traders who blindly trade breakouts sooner or later begin to lose their deposits. What causes this process?
How to identify a false breakout
Before we get down to the actual definition of a false breakout, let's take a deeper look at the terminology and, most importantly, the reasons for its occurrence.
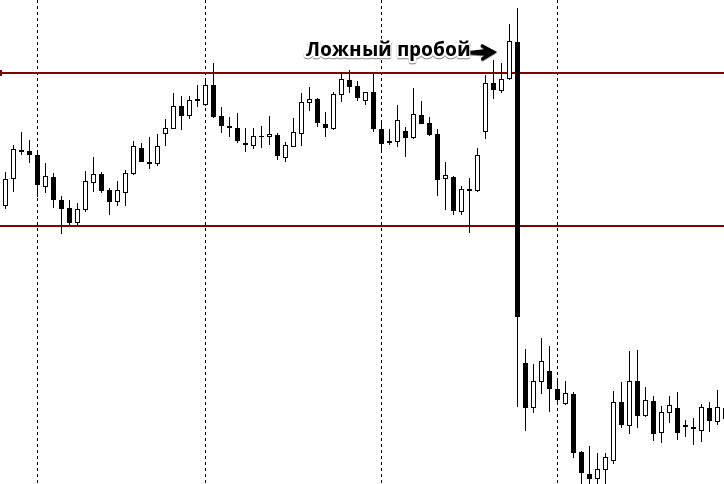
A false breakout is a breakthrough of a price support or resistance level by fractions of a point, after which the price rolls back to some starting points.
Simply put, this is a situation in which a breakout of a price level does not lead to further price movement in the direction of the breakout, but rather to its return to the price channel.
A second, more logical question arises: what is the actual cause?
In fact, there could be several. First, a false breakout often occurs due to the actions of major players. However, don't assume that someone with multi-billion dollar capital is playing against you.
To achieve certain goals, a major player simply has to gradually accumulate positions, opening them in varying sizes at multiple points.
Naturally, many begin to follow this movement, after which either the actual goal is realized when the market approaches a more favorable price, or positions are dumped. Either way, the price fluctuates during such moments, and as a result, false breakouts occur.
The second reason is far more mundane, and is, of course, related to the inappropriate behavior of the crowd. The fact is that when momentum appears in the market, everyone unconditionally perceives it as an opportunity to profit by opening a trade in its direction.
It would seem that the market is active and nothing foreshadows trouble. However, a huge number of players open positions at the last minute, which leads to the price continuing to move by inertia for some time.
Then fear sets in, as players, afraid of losing their profits, begin to close their positions and sell off the asset, which undoubtedly pushes the price back down.
These two reasons raise a logical question: how to identify a false breakout? In the stock market, study the volume. The fact is that false breakouts are not backed by large capital or money supply.
In the forex market, this situation is slightly worse, since traders don't see actual volume, but rather tick volume. However, even tick volume clearly demonstrates whether real capital is behind the breakout or not.
Trading False Breakouts:
The main mistake everyone makes when working with levels is, of course, rushing and trying to enter the market at the very moment of the breakout.
However, it's important to understand that until the breakout occurs, you'll never know with 100% certainty whether it's a false breakout or a real one. Therefore, to determine what kind of breakout you're dealing with, the first thing you need to do is wait for the candle to close.
Most false breakouts have a long shadow, which only indicates that the price has no potential to move further. However, to see this, you need to wait for the candle to close.
Sometimes, a breakout occurs with a full-bodied candle. In such cases, you need to wait for the second candle to close after the breakout. If the breakout is false, the price will return to its starting point.
Thus, trading false breakouts is essentially no different from trading a pullback from levels, since all trades are opened to return to the starting point of the impulse.
If a false breakout is detected upward, open a sell position, and if a false breakout is detected downward, open a buy position.
 False breakouts can also occur not only at horizontal levels but also at vertical ones. A similar situation can be encountered when trading along a trend line or price channel. The algorithm is virtually identical.

Learn more about Japanese candlesticks at http://time-forex.com/ys
False Breakout Indicator
Identifying a false breakout is fairly easy; the key is to be confident in your own conclusions. Doubt manifests itself when, instead of trading the false breakout that arose as a result of a piercing shadow, the drawn line begins to move along the new shadow.
A false breakout indicator can help overcome this doubt, or, more specifically, any level indicator that does the marking for you.
Such tools can include Pivot, Murray levels, or simply support and resistance indicators. They mark according to a strict algorithm, completely eliminating any doubts about it.
For example, you can see one of these Pivot level indicators in action below:

In fact, the situation with false breakouts is much simpler than many who have encountered them in practice believe.
However, knowing the basic principle behind this phenomenon, you can open a trade contrary to popular opinion and earn a significant profit.
Download the false breakout indicator.
You can find other necessary indicators at http://time-forex.com/indikators

