Bollinger Bands Strategy
We've all seen Bollinger Bands used in various trading strategies.  The tool is so versatile and provides such a wide range of signals that it can be used by scalpers, pipsers, and swing.
I decided not to focus on the historical nuances and general properties of the indicator, since the general provisions were written earlier in the article Bollinger Bands, so let's get straight to the point.
If you take the time to read the book "Bollinger on Bollinger Bands," you will discover that even the author himself does not give clear recommendations on when to buy or sell.
John Bollinger provides no more than recommendations for its use, and it is up to you to decide how exactly to use the indicator from all the signal variations, depending on your style and the market situation.
Therefore, the Bollinger Bands strategy is more like a summary of application recommendations than a clear trading strategy. You may be familiar with some of its applications, but I hope you'll learn something new.
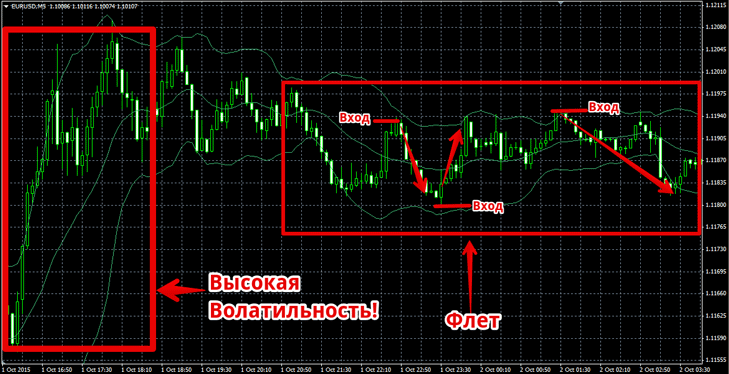
The first option, popular with almost all scalpers, is trading within the channel, or more precisely, trading outside its boundaries. This is because, as Bollinger Bands themselves claim, the price spends almost exclusively within the channel and rarely deviates beyond its boundaries.
However, when choosing this strategy, you need to identify flator accumulation zones. You can encounter this market phase when the bands narrow after they had widened significantly, and the chart had been volatile before.
To formulate the rules more clearly, you should sell when the price touches the upper boundary, and buy when it touches the lower boundary. Take profit after touching the opposite line, and place a stop outside the channel. Let's look at the image below in more detail:
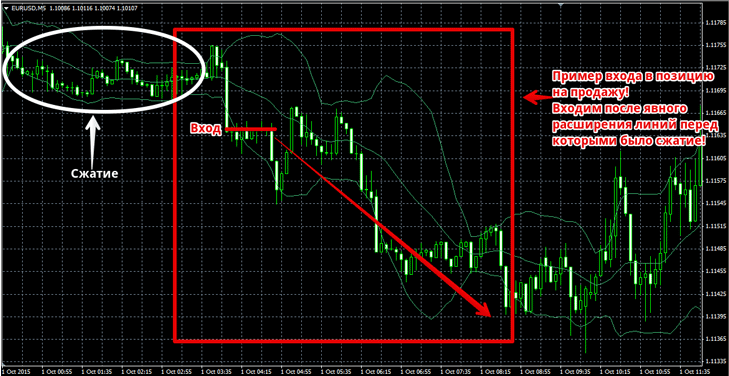
The second method is effectively used by day and swing traders. It involves entering a position when the trend continues, or, more simply, entering with the trend. According to the Bollinger Bands strategy, if the price breaks the upper band and the bands begin to widen due to high volatility , this is an excellent opportunity to enter a buy position.
When the price breaks the lower boundary and the bands widen, it's time to enter a sell position. Typically, traders using this tactic set their stop at the center line or the nearest local high or low. See the image below for more details:
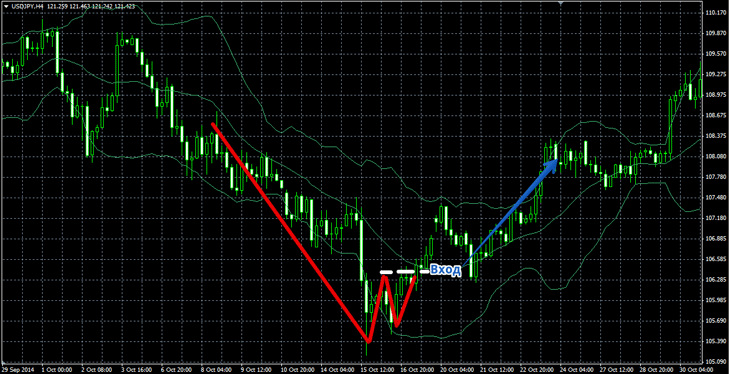
In addition to the standard approach to using Bollinger Bands, the indicator is used to identify various patterns. For example, the author of the book describes two of the most popular reversal patterns, namely the W-shaped pattern and the M-shaped pattern. The W-shaped pattern forms in a bearish market and is characterized by two lows, with the first low extending beyond the lowermost band, and the second low forming within the channel.
This pattern is nothing more than a "Double Bottom," as described in any technical analysis book, but with a filter applied. If this pattern forms in front of you, it's a signal for a trend reversal, so it's time to enter a buy trade. See the example in the image below:
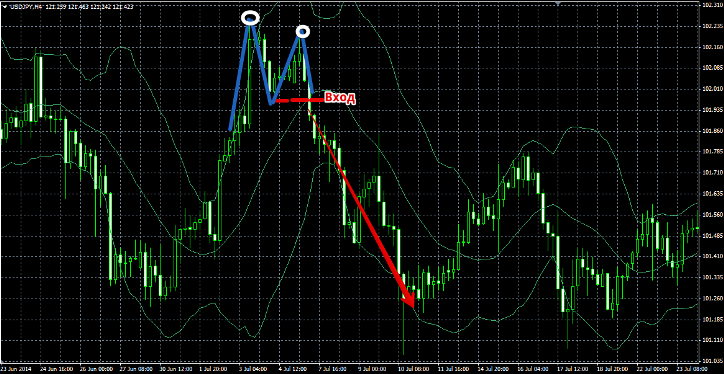
The M-shaped pattern is a clear analogue of the pattern discussed above, the only difference being that the M appears during an uptrend. To enter a sell position, the first peak formed must break outside the Bollinger Bands, and the second peak must form within it. An example of the pattern is shown in the image below:
Despite the multi-tasking nature of the tool and the number of possible signals, even John Bollinger himself said: “Finally, tape touches are just that – touches, not signals.” Therefore, it is necessary to take into account all fundamental factors, use additional indicators and figures to confirm the signal, and not use it alone.

