Bar Strategy: A Simple Market Analysis Method by John Benjamin
Human psychology is structured in such a way that as soon as big money is mentioned, it is associated with work of enormous complexity.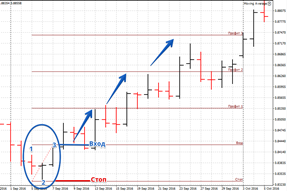
Therefore, most traders approach the choice of strategy based on the principle: the more complex the strategy, the more money it can bring.
This distorted perception of reality leads to a newcomer to the exchange immediately drowning in a mass of unnecessary information that is simply impossible to grasp without professional knowledge and experience.
Therefore, whether you are an experienced market participant or just starting out as a trader, you need to remember a simple truth: the simpler the strategy, the more profitable and resilient it will be to sudden market changes.
The Bar Strategy is a simple trading strategy based on a three-bar pattern that was first published and widely promoted by John Benjamin, a renowned analyst with over nine years of stock market trading experience.
The strategy is relevant for all types of traders, whether you trade on five-minute or daily charts, as trends and their changes can be seen on all time frames.
It's also worth noting that the bar strategy is multi-currency and demonstrates equal effectiveness across all trading assets, from stocks to currency pairs and indices.
Preparing a Bar Strategy
Before you start trading using the strategy, it is very important to prepare your work area.
It's worth noting that this strategy can be applied to any trading terminal that features a bar chart and Fibonacci retracements. In our case, we'll be using the MT4 terminal.
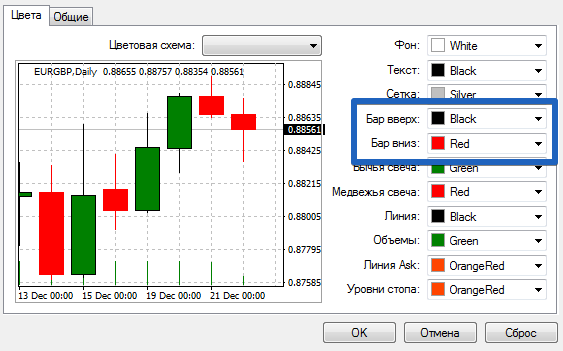
First, switch your chart display from candlesticks to bars. Then, for your convenience, next you'll need to change the bar color, as by default they'll all be the same color.
To do this, go to the chart settings and change the color of the bearish bars to red, or to any other color that is more convenient for you.
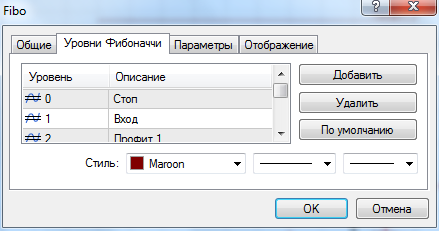
Then randomly apply the Fibonacci Lines tool to the chart and go to the levels' properties and settings. You'll need to make some changes to the levels and rename them.
So, assign the name "Stop" to level 0, "Entry" to level 1, "Profit 1" to level 2, "Profit 2" to level 3, and "Profit 3" to level 4. Once the preliminary workspace preparation is complete, you can begin analyzing the pattern itself and working on it. See the image below:
Pattern characteristics. Signal
Since the counter-trend strategy searches for patterns on clearly defined trends, positions are built in the opposite direction.
To determine the current trend, you can use any technical analysis tool or trend line.
The author himself recommends paying attention to the number of candles and local extremes, namely if the price rewrites the local minimum, forming new minimums - downward trend, and if the price rewrites the highs and forms new highs, the trend is upward, but there should be at least five bars in such segments.
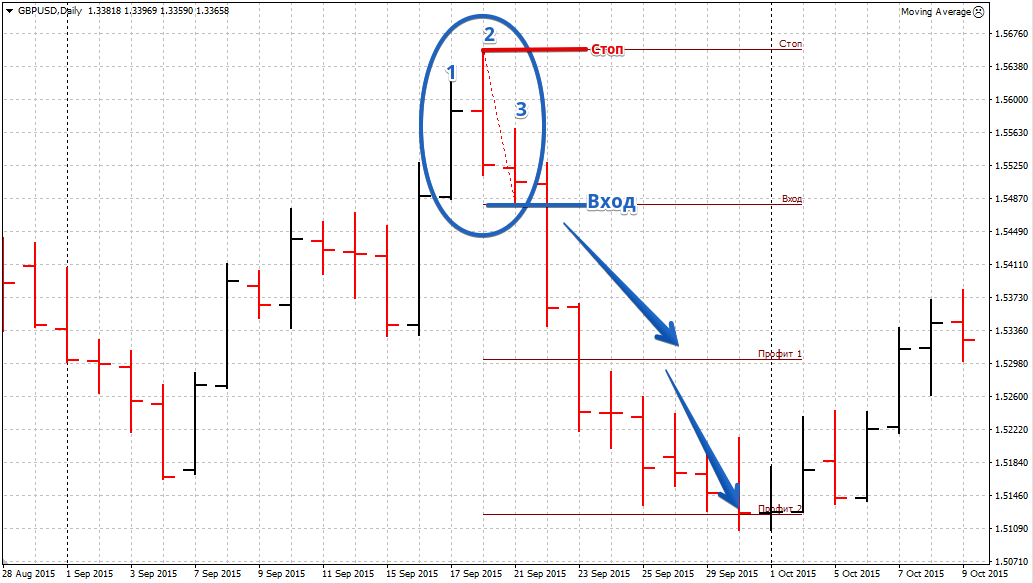
Bearish trend reversal pattern
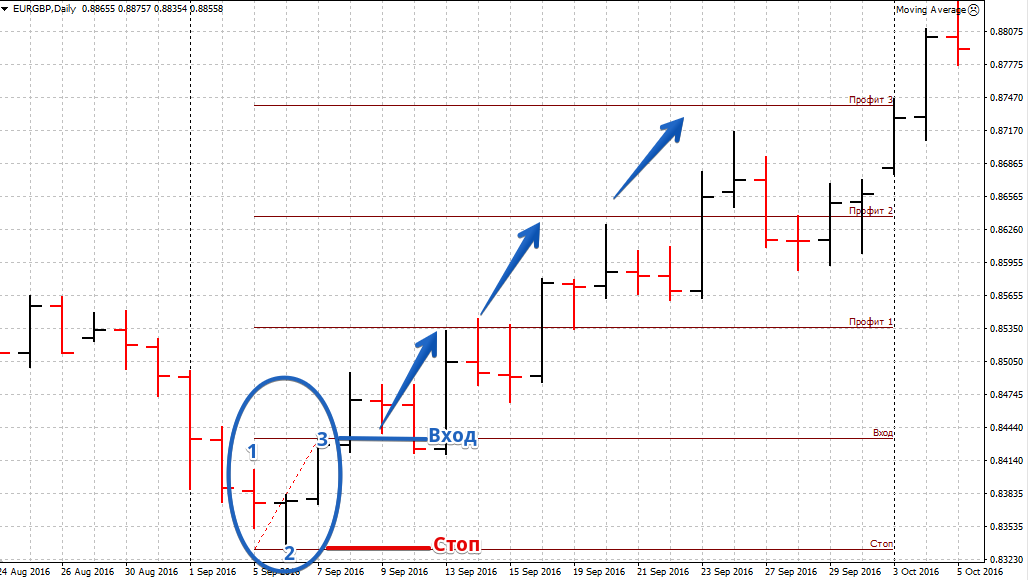
1. On a downtrend, a bar appears whose minimum is lower than the previous one, and whose maximum is also lower than the previous bar (the bar itself is bearish and red).
2. The minimum of the second bar is located below the first candle, but at the same time the bar itself closed bullish and is black.
3. The minimum and maximum of the third bar should be located above the second bar, and the candle should close black.
Next, draw Fibonacci lines from the high of the third bar to the low of the second bar. The entry point is when the price crosses the high of the third bar or the Fibonacci level marked as the entry. Stop and profit orders are placed at the corresponding Fibonacci levels
Bullish trend reversal pattern
1. On an uptrend, a bar appears whose maximum is higher than the previous one, and whose minimum is also higher than the previous bar (the bar itself is bullish and black).
2. The maximum of the second bar is located above the first bar, but at the same time the bar itself closed bearish and is red.
3. The maximum and minimum of the third bar should be located below the second bar, and the candle should close red.
Just like for purchases, we pull Fibonacci levels From the low of the third candle to the high of the second. The line names will correspond to the order placement.
In conclusion, it's worth noting that the "Bar Strategy" is an excellent example of a non-indicator trading strategy that, despite its simple algorithm, can demonstrate very high profitability.

