Moving Average Strategy
Everyone's heard the famous stock market saying that the trend is your friend. However, determining the trend's direction and trading only in line with it is one of the most difficult tasks for any beginner.
To determine a Forex trend, you need to use various trend-following tools. If you want to develop a truly effective trading strategy, you simply must include trend-following indicators in your strategy.
The moving average strategy is a trading strategy based on the most popular trend-following technical indicator, the Moving Average. It's no secret that moving averages are the best way to clearly depict the current market trend, promptly indicate entry points, and also indicate a potential market reversal. The
moving average strategy we'll explore in this article uses three moving averages that indicate entry points, eliminate false signals, and allow you to identify the global trend.
Installation
The moving average trading strategy consists of standard MT4 indicators, so the only thing you need to install is a ready-made template that will allow you to automatically apply indicators to the chart instead of dragging them individually. To do this, download the ready-made template at the end of this article and place it in the Template folder.
To find the required folder, launch the trading platform and open the root directory in the File menu. After you've downloaded the template, close the root directory and update the installed component in the Navigator panel. After updating, the file should appear in the template list.
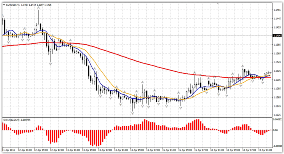
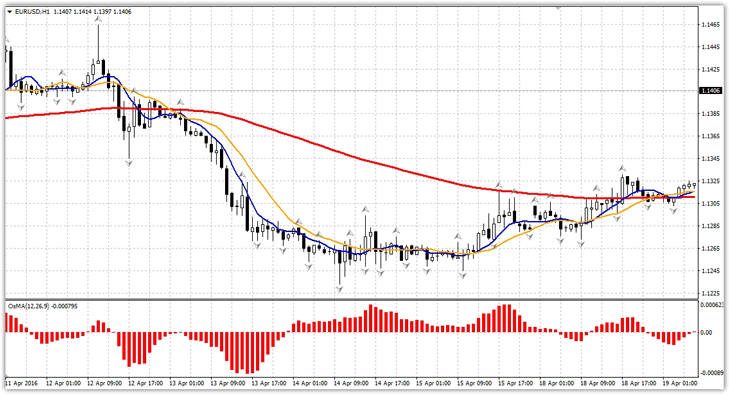
To launch it, open the additional menu on the chart and select "Moving Average Strategy" from the template list. The template launch result is shown below:
Strategy Components. Functions and Settings.
The strategy is based on three indicators, only two of which actually influence trading decisions. The strategy uses three moving averages with periods of 120, 7, and 14. The 120-period moving average is used to determine the main global trend: if the price is above the red line, the market is in an upward trend, while if the price is below it, the market is in a downward trend.
In the strategy, the price's position relative to the 120-period moving average serves as a benchmark for trades.
The 7- and 14-period moving averages, which you can see on the screen in yellow and blue, determine entry points. When the fast moving average crosses the slow moving average, we receive a signal according to our strategy.
It's important to understand that signals will only be taken into account if the price is relative to the 120-period moving average.
The OsMa indicator in the strategy performs a fairly simple function – it filters out trends and false signals. Thus, you can only buy if the OsMa histogram is above its signal level, and you can sell if the histogram is below the signal level.
The third and final indicator, Fractal, is an optional tool and serves only as an aid in determining where to place a stop order. Understanding which indicator performs which function allows you to easily change the parameters, adapting the strategy for trading on shorter time frames.
Moving average strategy signals.
There are two types of signals here: a primary strong signal and a secondary weak signal. Both of these signals require certain conditions, which we'll discuss below.
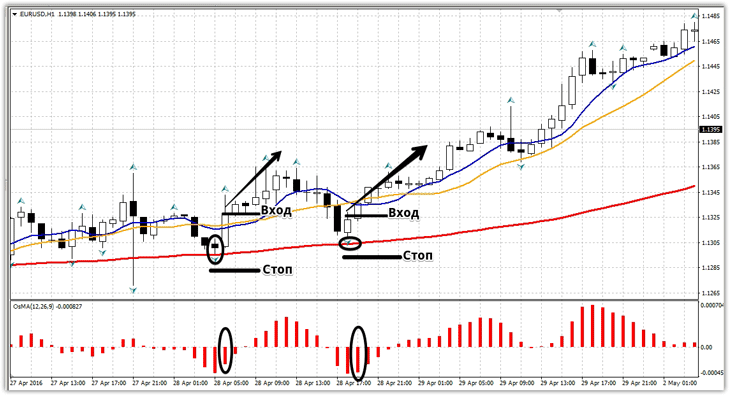
Basic buy signal:
1) The price is directly above 120 before a moving average.
2) The 7-period moving average (blue) has crossed the 14-period moving average (yellow) from bottom to top.
3) The OsMa histogram is above zero.
It's crucial to enter only on a closed candle, as the crossing of the moving averages can change in the event of a sharp price change. A stop loss should be placed at the downward-pointing fractal arrow.

The basic premise for an additional buy signal is that the 120-period moving average acts as support. So, the additional buy signal is:
1) The price has moved downwards and touched the 120-period moving average.
2) We wait for the OsMa histogram bar to decrease below the signal line.
We enter only on a closed candle, and we place a stop order 5-10 pips beyond the 120-period moving average. Example:
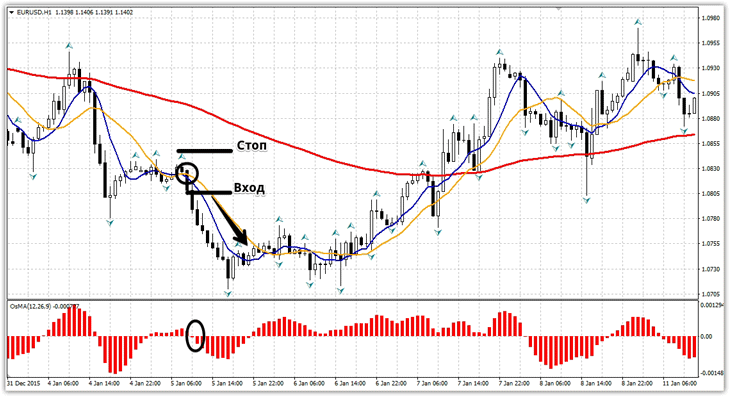
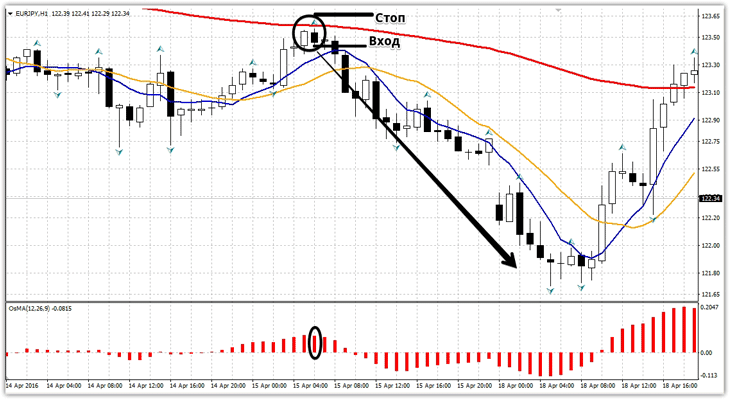
Basic sell signal:
1) The price is directly below the 120-period moving average.
2) The 7-period moving average (blue) has crossed the 14-period moving average (yellow) from top to bottom.
3) The OsMa histogram is below zero.
It is crucial to enter only on a closed candle, as the crossing of the moving averages can change in the event of a sharp price change. A stop order should be placed along the upward-pointing fractal arrow.
The basic premise for an additional sell signal is that the 120-period moving average acts as resistance. So, the additional sell signal is:
1) The price has risen from below and touched the 120-period moving average.
2) We wait for the OsMa histogram bar to decrease above the signal line.
We enter only on a closed candle, and we place a stop order 5-10 pips beyond the 120-period moving average. Example:
In conclusion, it's worth noting that the moving average strategy is a truly effective tool for capturing profits in trending markets. A drawback of the strategy is a slight delay in signals, but this is more of a technical feature of the signal indicators than a drawback.
Download the Moving Average Strategy Template.

