Trading strategy "Super scalper in the channel".
Everyone knows that scalping is an extremely profitable trading tactic. Ensuring successful  trades while maintaining a tight stop loss is a basic rule for a successful scalper. However, to ensure profitable trading over the long term and react intelligently and quickly to any price fluctuations, you need to adhere to clear trading strategy rules.
The "Super Scalper in the Channel" trading strategy is a scalping trading strategy, and the scalping process itself takes place in a narrow channel, so the strategy can also be defined as a channel strategy.
It can be used on any currency pair, but is particularly effective on the EUR/USD, GBP/USD, and AUD/USD pairs. Trading is conducted on a one-minute chart, but if you notice poorly formed candlesticks, specifically, poorly formed ones, I recommend switching to a five-minute chart.
You can see this candlestick pattern early in the morning, when the market is still sluggish and less active.
Before analyzing the trading signals, the strategy must be installed in the Meta Trader 4 trading terminal. Download the file with the indicators and template at the end of this article.
The next step is to go to your terminal's file menu and open the data folder. Next, place the indicators in a folder called "indicators" and the template in the "Template" folder, then restart the terminal. Once launched, go to your terminal's template list and run the template called "Super Scalper in Channel." If you've done everything correctly, the chart will look like this:
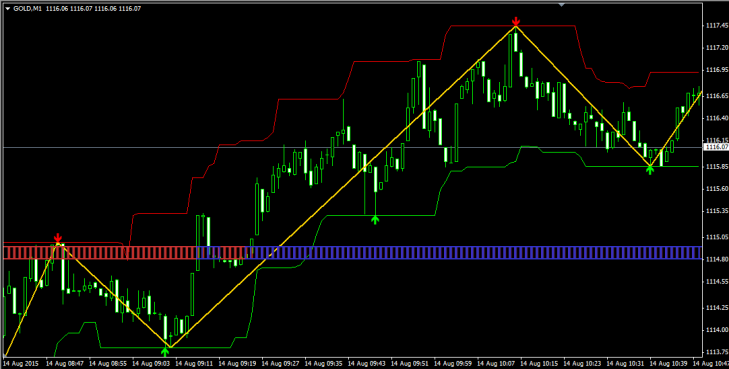
As you can see, a channel has formed around the price, and we'll be trading from its boundaries. The strategy itself consists of three indicators, one of which is a signal indicator, one of which filters positions, and one of which serves as an informational indicator. Here's a brief overview of each:
1. Super signals channel – the indicator is displayed as two lines, red and green, forming a channel around the price. When the price touches the channel boundary, an arrow appears, signaling a rebound from the channel boundary. This indicator serves as a signal indicator and forms the basis of the entire trading strategy. In the settings, you can set the period and the number of bars for which the trading history will be displayed.
2. Price Channel ZigZag_v2 – displayed as a yellow line within the channel. This indicator is a simple modification of the standard ZigZag indicator. It serves a more informative purpose, as it shows the trend direction and the extremes at which entry signals most often occur. This indicator also helps find exit points.
3. FT PVD – the indicator is displayed as a strip with red and blue bars. In the strategy, it filters the trend. If the trend is bullish, the bars are colored blue; if it's bearish, they're colored red. It's a standard modification of the moving average, so you can change the moving average period and its application type in the settings.
Overall, the strategy's basics are clear, and all the indicators discussed can be easily optimized, so reconfiguring the strategy from scalping to trading on higher timeframes won't be difficult. Now, from analyzing the components, let's move on to the trading strategy's signals.
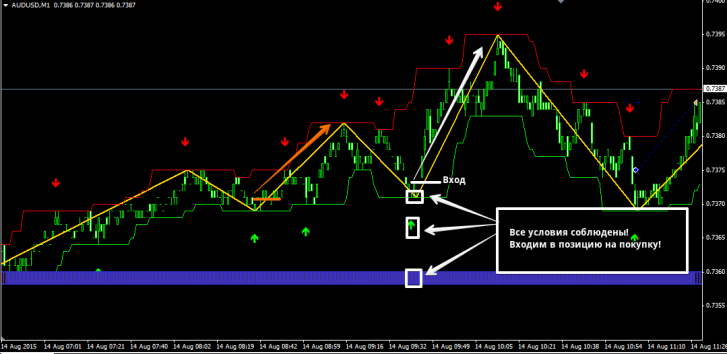
We enter a buy position when the following conditions are met simultaneously:
1. The price touched the green border of the channel, and the Super signals channel indicator drew a green upward arrow.
2. The Price Channel ZigZag_v2 indicator line is directed downwards.
3. The bars of the FT PVD indicator are colored blue.
We enter positions only on a closed bar! See the image below for an example of a buy entry:
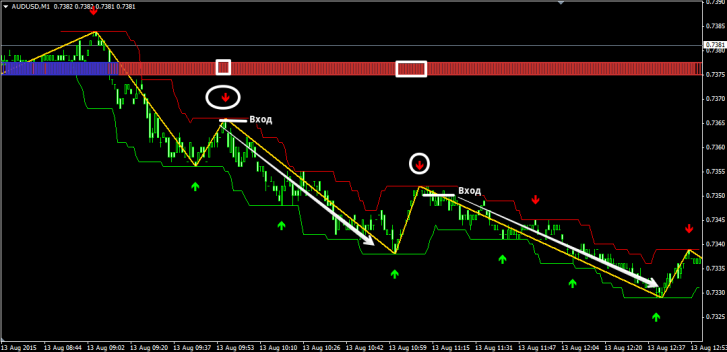
We enter a sell position when the following conditions are met simultaneously:
1. The price touched the red border of the channel, and the Super signals channel indicator drew a red downward arrow.
2. The Price Channel ZigZag_v2 indicator line is directed upwards.
3. The bars of the FT PVD indicator are colored red.
We only enter positions on a closed bar! See the image below for an example of a sell entry:
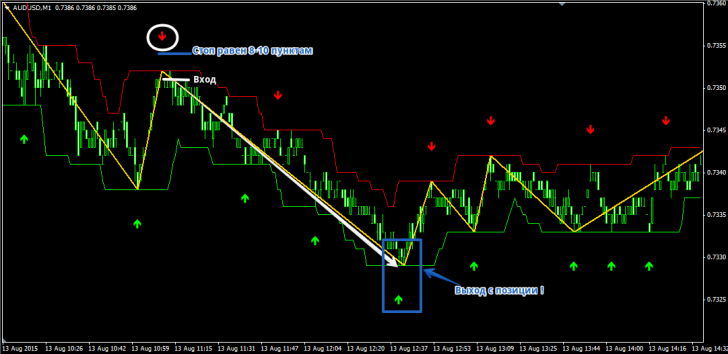
The position is exited when an arrow appears in the opposite direction. However, it's important to note that not only should the arrow appear, but the Price Channel ZigZag indicator line should also be at the same point, forming a new extreme.
A stop order should be placed at the minimum or maximum of the signal candle, depending on the entry, as well as at local highs and lows. On average, a stop order is 8-10 pips, so you can use a fixed stop order of 10 pips. See the example in the image below:
Overall, the strategy has a number of clear rules that must be followed for successful trading. Remember, scalping without discipline is a doomed endeavor. Carefully calculate risks and don't forget about money management, without which no strategy in the world can deliver consistent results.
Download tools for the strategy.

