Support level (support level).
Typically, the price of a currency pair moves according to a certain pattern, sometimes rising, sometimes falling. Regardless of the trend direction, there is always a conventional boundary at which the price reverses upward. In trading, this boundary is commonly referred to as a support level or line.
A support level is a line on a currency pair chart drawn along significant price lows over a specific time period. It characterizes the price level at which the market enters an oversold state and the price moves upward.
The theory suggests that as this line is approached, sellers' supply of the financial asset begins to decrease, as the price becomes unfavorable. At the same time, the number of sell orders from buyers increases, halting the price decline. As soon as demand begins to outweigh supply, the market enters the overbought zone and the trend reverses.
Drawing the line is quite simple: open the required timeframe and identify several points representing the minimum price values over this time period. There must be at least two such points. The line can be drawn manually or using the tools available in the Forex trader's terminal.
The support level is one of the main benchmarks in forex trading. It tells traders where the price is most likely to reverse upward.
During an uptrend, reversal points near this line are the best entry points, as they allow for a significant increase in potential profit per trade.
During a downtrend, these are the points where a correction against the main trend occurs, and it is at these moments that it is advisable to close existing trades to preserve maximum profit.
If the forex market is flat, the support level is used as a benchmark when placing pending sell orders, which are placed slightly beyond the assumed level. The order is triggered if the support level is broken, and if the price continues to move, the trade is considered profitable.
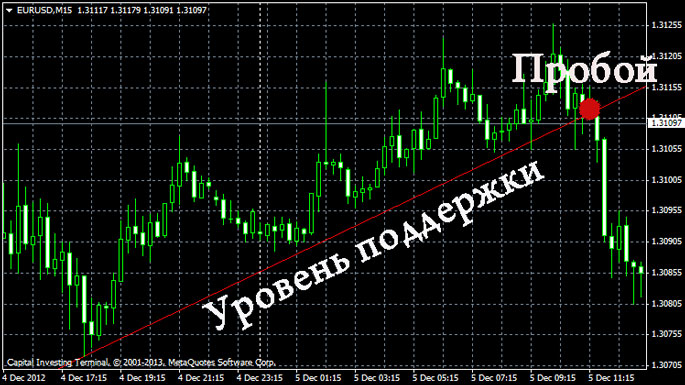
Breakout of support level.
If, contrary to expectations, the price of a currency pair continues to move downwards instead of reversing, a support level can be considered broken. This line will then shift, and a new level will be drawn based on new lows on the time frame in question. An entire breakout strategy.
When plotting support lines (levels), it's important to keep in mind that they are unique to each trading timeframe. The easiest way to automate this process is with specialized Forex indicators.

