
Options indicator
Options trading is a kind of know-how that appeared quite recently.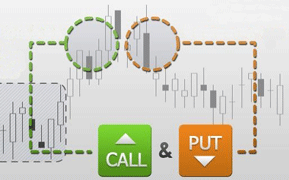 As you understand, anything new is most often a continuation or improvement of something old.
Trading binary options is very similar to trading on the forex market or the stock exchange, because it is based on the price of the asset, which is constant regardless of which exchange you trade on.
But, unfortunately, many beginners, deceived by advertising, very often treat options as an ordinary game of guessing higher or lower and do not even suspect that the options themselves can bring money only in the hands of a professional.
Almost everyone who begins to delve into the topic of options is faced with the problem of using one or another instrument to enter the market. It so happens that the vast majority of brokers do not provide a modern trading platform, and a beginner, as a rule, sees a bare chart and two buttons above or below.
Trendwave indicator
Trendwave is a unique development of a foreign trader, which is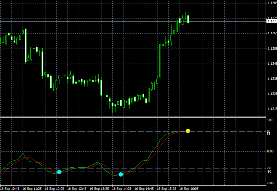 an oscillator indicator based on overbought and oversold zones.
Just a year ago, this indicator could not be found in the public domain, since its author sold it on various trading platforms for quite a large sum.
Of course, as usually happens in trading, sooner or later everything paid becomes free, since all it takes is one dissatisfied person for this miracle to be freely available.
The Scalper MA indicator is scalping accessible to everyone.
Your success in trading the Forex market largely depends on the right tactics. Scalping is the most popular method due to its high profitability and speed of achieving results. However, applying skills on a fast-moving volatile instrument is not so simple, despite the various strategies that are so actively distributed throughout the Internet space.
Almost all novice traders try to scalp, chasing quick profits, while they do not even understand what moves the price, how it reacts to various economic and political indicators.
Even the pros try to avoid scalping , because its whole essence is based on the fact that you make money on market noise, and do not trade according to the global trend. It is quite difficult to predict the movement of market noise based on fundamental indicators, so technical indicators are indispensable assistants, without which it is difficult to imagine a scalper.
Trend Magic indicator – trend guide
Many beginners often face such a problem as determining the global trend.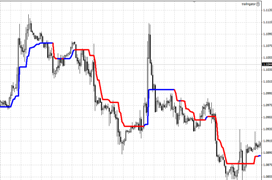 Almost all traders look at local price movements, mistaking pullbacks for a new trend and vice versa.
As a rule, entering against the market always backfires on all of us, because as many psychologists say, “You can’t fight the crowd.”
Indeed, there are various tools, such as trend lines or channels, but often the market diverges so much in different directions that constructing any figures simply does not give us objective information.
The Trend Magic indicator is a trend indicator whose main task is to show the direction of the trend.
Parabolic SAR indicator
Very often, most traders are faced with a situation where they do not know where to exit the market or place a stop order. Of course, entering a position correctly is good, but how to exit correctly so as not to do it in advance or, as they say, when it’s too late (a new reversal takes all the profit) is one of the most difficult tasks that every trader faces.
Wells Wilder also faced such a task at one time, the result of which was his new Parabolic SAR indicator. The indicator appeared before the general gaze of traders in 1976 in the author’s new book entitled “New Conceptual Concepts in the Field of Technical Trading Systems.”
At that time, this book simply became a boom in the field of trading, so most beginners begin their journey with it.
If you translate the abbreviation SAR literally, you can understand the whole essence of the indicator, since its translation is: “Stop and Reversal.”
Indreverse indicator.
A signal indicator indicating a market reversal using multi-colored arrows.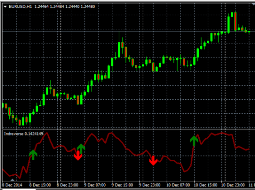 Allows you to find out in advance about an upcoming change in the direction of price movement and close existing positions.
Another attempt by the script author to guess the upcoming trend; if we evaluate the history of signals, we can say that more than 60% turned out to be correct.
The result is rather not good; it does not allow us to recommend the Indreverse indicator as a signal provider when opening new positions; it is recommended to use an additional filter to check signals.
Which can be another indicator of technical analysis, which also analyzes the trend and gives an assessment of the likelihood of a reversal.
Tick indicator.
Most traders are accustomed to the fact that the minimum time period on the Forex chart is M1, but within one minute the price makes a lot of movements, they are called ticks.
A tick is a price change, the distance between two subsequent quotes, that is, in fact, it is the minimum unit of measurement for the price of a currency pair.
The tick indicator allows you to display a tick chart on the screen in a standard trader’s terminal, on which the slightest price changes will be clearly visible.
It is advisable to use the indicator only on a minute time frame; on longer time periods, the tick curve simply turns into an almost straight line and does not carry useful information.
VininI LRMA color (reversal indicator).
An interesting version of the indicator that will warn you about a trend reversal and the beginning of a new trend, which will allow you to close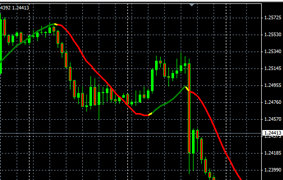 old transactions without losses and open new ones at the most favorable moment.
The reversal indicator warns the trader by simply changing the color of the trend line, and if you analyze the history, the signals are given with fairly high accuracy.
The tool can be used with equal efficiency both for entering the market and for timely closing of existing positions, and it has no restrictions on currency pairs and trading time period.
VininI LRMA color works as follows - after adding a trader to the terminal, a curved line appears on the chart that follows the movement of the trend, but at the same time:
Improved Stochastic.
It is difficult to meet a trader who is not familiar with the Stochastic oscillator; a similar technical analysis tool is built into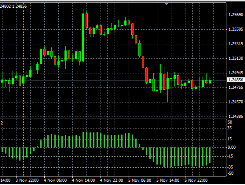 every metatrader terminal and is quite effective.
Stochastic works by using overbought and oversold levels, which are formed by supply and demand.
Overall, the tool is not bad, but it can be improved if desired.
The presented improved Stochastic is precisely an attempt to make the familiar script more efficient.
Indicator - Fractal price.
Trading using fractals has long become one of the most popular strategies, but not everyone can easily detect this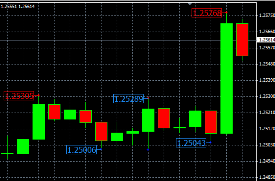 pattern on a currency chart, so you can use a special indicator to solve this problem.
One such script is the Bill Williams Indicator or Fractal Price Indicator.
As the name suggests, Fractals_Price displays the most important price levels of fractals on the chart of the selected currency pair.
Installed according to the standard scheme, does not require additional configuration, you can only change the colors of the inscriptions.
Japanese candlestick indicator.
Trading using Japanese candlesticks is often used in Forex, a new candlestick combination can confirm the current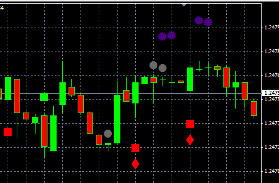 trend or warn of an upcoming reversal. But constantly monitoring the chart of a currency pair is quite tedious; a special indicator can make the process easier.
Japanese candlestick indicator - using multi-colored figures, informs the trader about the appearance of a new candlestick combination, which greatly simplifies trading.
All parameters in the indicator are set by default, the user can only change the displayed interval in bars, the standard setting is set to 1000.
DC signals indicator.
Finding entry points into the market has always been the primary task of any trader; this is actually half of a successful transaction.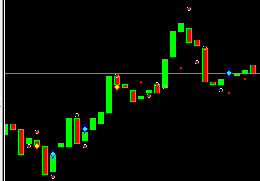 There are many options for solving this problem, but the easiest way to do this is using a special indicator.
The DC signals indicator is precisely a script for searching for entry points into the market; it analyzes the current trend on the time period you specify and gives a signal to open a transaction indicating its direction.
All you have to do is download and install it on the chart, and then monitor the appearance of signals, the indicator works according to the following principle and has the following settings.
iVAR indicator.
Easy to use and quite effective in operation, the iVAR indicator provides an opportunity to assess the strength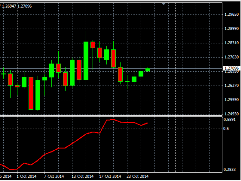 of the currently existing trend.
The iVAR indicator automatically switches and recalculates the strength of the trend on the selected time period, which allows you to optimize trading as much as possible and find the most successful entry points into the market.
The tool can also be used as a source of signals to close transactions; it will warn in advance of a major rollback or trend reversal.
The work of the script is based on the analysis of fractals, and this is the secret of its effectiveness and versatility; it can be used on any time frame and for any currency pair.
Heiken ashi indicator.
One of the most famous indicators, which is used when working with Japanese candlestick charts, is used when conducting a visual analysis of a trend; according to the authors, it creates a more realistic picture of the existing trend.
The main advantage of this tool over standard candles is that it works a little with a delay, analyzing the data received and displaying the result on the chart of the currency pair , but it is not leading, but it really evaluates the trend.
The Heiken Ashi indicator operates according to a fairly simple scheme using the average price of the previous candle, which allows you to filter out sharp price jumps and make the movement cleaner.
Indicator for determining the trend.
The indicator combines two functions - measuring the strength of an existing trend and its short-term forecast, that is, you can not only assess how strong the existing trend is, but also see the expected continuation of the trend line.
The indicator for determining the trend bases its work on such a popular script as Moving Average , that is, the calculations use the same Moving Average, a tool proven over the years for analyzing historical data on price movement.
After you add the indicator to the desired chart, two lines will appear:
The best trend indicator.
There are many different trend indicators, each of them is good in its own way, but basically they all just show the current trend.
The best trend indicator not only displays the existing situation, but also tries to extend the trend line several bars ahead, so to speak, gives a short-term forecast, this is done based on the history of the exchange rate movement on a given time frame.
The work of the script is based on Wave theory and statistical data on the most important minimums and maximums in the selected time period.
Trend direction indicator.
Continuing the topic of trend indicators, we present to your attention another tool that allows you to determine the current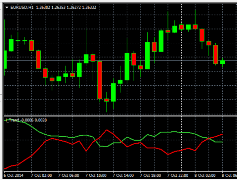 trend direction in Forex or other financial markets.
Trend direction indicator - analyzes historical price values while constantly monitoring their changes, which allows you to quickly display signals about the likelihood of a change in trend direction on the chart of the trading terminal.
The script combines ease of use and fairly high operating efficiency, which makes it possible for even a little experienced player to use it for trading.
Immediately after installation in the trading terminal and launch, the trend direction indicator will appear in a separate window below the chart of the currency pair. His work is conveyed through two horizontal curves of red and green.
Trend strength indicator.
When opening a new transaction, every trader wants to know how long the existing trend will last, whether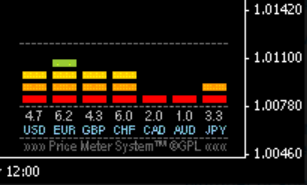 it will make a reversal immediately after the order is placed.
The trend strength indicator provides an opportunity to find out this moment; the tool shows how actively a particular currency is being sold and bought.
Unfortunately, the indicator shows information specifically for currencies, and not for currency pairs, and the trader will have to independently draw conclusions regarding the trading instrument.
“Trend all period” indicator.
The name of this indicator speaks for itself; it is designed to simultaneously determine the trend for all periods.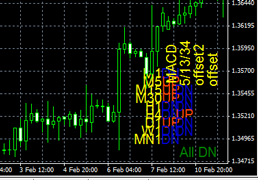
There is no need to explain that this approach provides a more complete picture of the market situation.
The "Trend for all periods" indicator is one of the best trend tools that does not require additional settings.
Elder indicator.
Often this indicator is also called “Bulls-Bears”, since its main task is to identify a change in trend.
Elder indicator - gives signals about a trend change and evaluates its strength, which allows you to prepare in advance for a market reversal.
This is a fairly advanced tool that has simple settings and excellent visual display of the received data.
The indicator can be classified as an oscillator, as it tries to get ahead of the market a little and warn the trader about upcoming changes.
Trend forecast indicator.
Xprofuter is one of the most well-known trend forecast indicators among traders, although the accuracy of the predictions is quite questionable, but perhaps editing the basic settings will change the situation.
The trend forecast indicator, according to the authors who created it, is ahead of the existing trend by 10-12 bars.
The principle of operation is based on creating your own trend line, which is displayed in a separate window and the second line, unlike the first, simply extends the existing trend on the chart.