TDI indicator
Market analysis and forecasting are difficult without technical analysis tools. 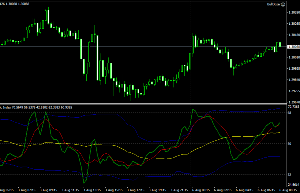
After all, all factors are interconnected in one way or another and can influence one another.
Trend direction, price movement speed, volatility, overbought or oversold conditions—all these factors determine future price movement.
This is why, in recent years, many traders have gradually moved away from standard forex indicators that measure a single market characteristic.
Complex hybrids are increasingly being used instead. A hybrid can combine two to five forex indicators in a single window, providing a more professional market analysis.
The TDI indicator is a complex hybrid consisting of at least three technical indicators, namely two trend-following Bollinger Bands and a Moving Average, as well as one oscillator, the Relative Strange Index.
Thus, TDI is a comprehensive tool that allows for simultaneous analysis of market conditions, trend direction, and, most importantly, volatility.
The script can be used on any trading asset in your MT4, and this feature applies to all time frames.
This makes TDI equally effective for both scalpers and long-term investors.
Installing the
Traders Dynamic Index indicator became very popular and world-famous after a trading strategy based on it, better known as "Trading Made Simple," was published on numerous international forums.
The thread featuring this strategy garnered over a thousand comments, while TDI, thanks to the accuracy of its signals, has become the basis for dozens of MT4 strategies.
Installation essentially follows a standard procedure. At the end of this article, there is a download link that you should follow to obtain the indicator file.
You will need to save this file to the "Indicators" folder in your MT4 directory. By the way, you can access the data directory directly from your MT4 by going to the File menu and selecting the appropriate option from the drop-down menu.
The third and final step after installation is to restart the trading terminal or update it using the additional menu in the Navigator panel.
 After completing all the steps, TDI can be found in the list of custom indicators, and applied to the chart, it looks like this.
Using TDI:
Your first encounter with TDI can be confusing, as the sheer number of lines can be overwhelming. But once you understand the basic principles of working with it, within five minutes you'll appreciate how simple a technical tool it is.
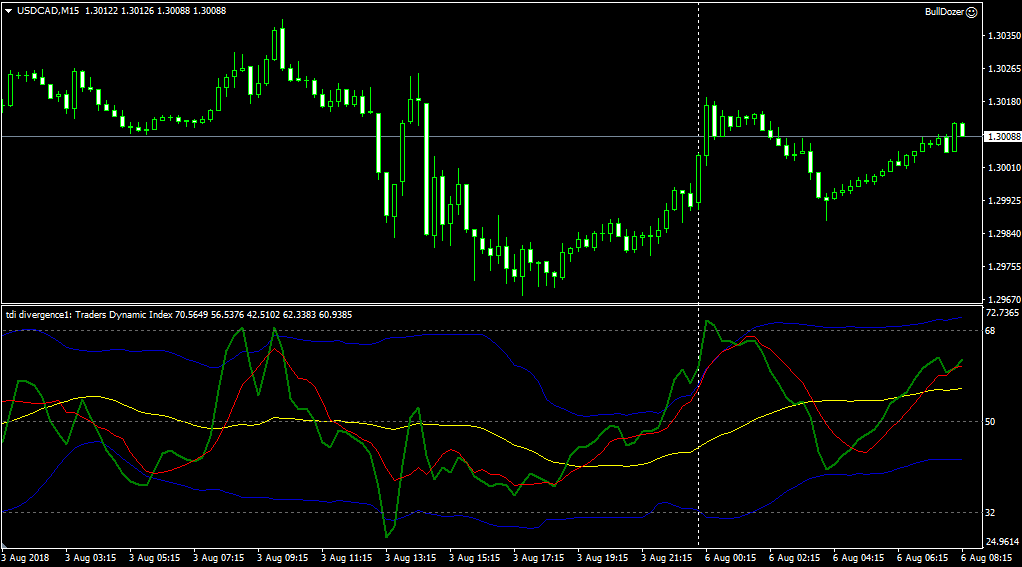
When applying this indicator for the first time, first, pay attention to the key levels numbered 68, 50, and 32. As with any oscillator, these levels mark the boundaries of overbought and oversold.
Trading should be done at these levels, specifically when level 68 crosses downwards – open a sell trade, and when level 32 crosses upwards – open a buy trade.
The next favorite signal used by all scalpers is generated by the interaction of the moving average and the RSI line. Therefore, when the green line crosses the red line from bottom to top, we open a buy trade, and when it crosses from top to bottom, we open a sell trade.
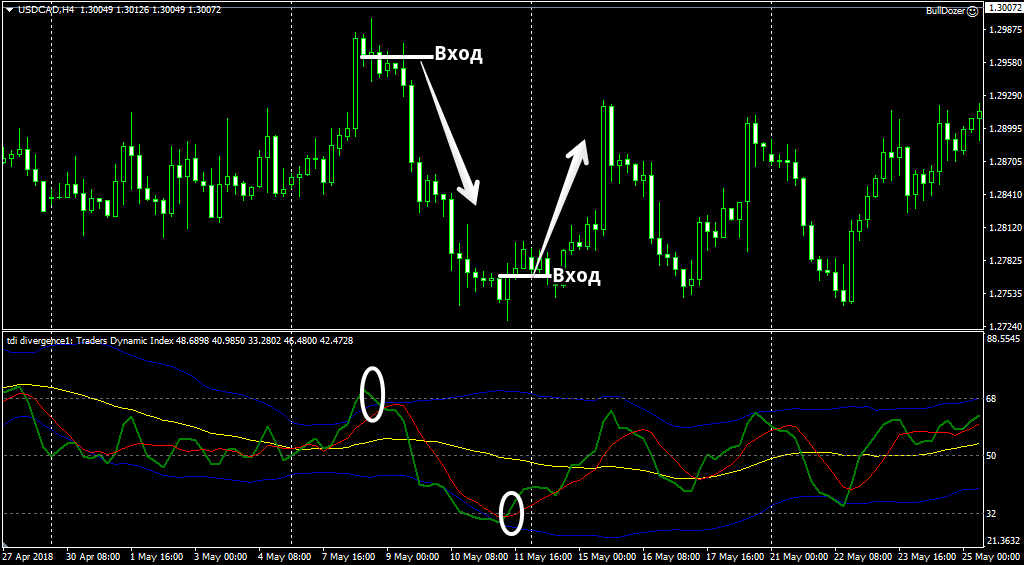
A stronger signal is considered to occur when such a crossover occurs in oversold or overbought market zones:
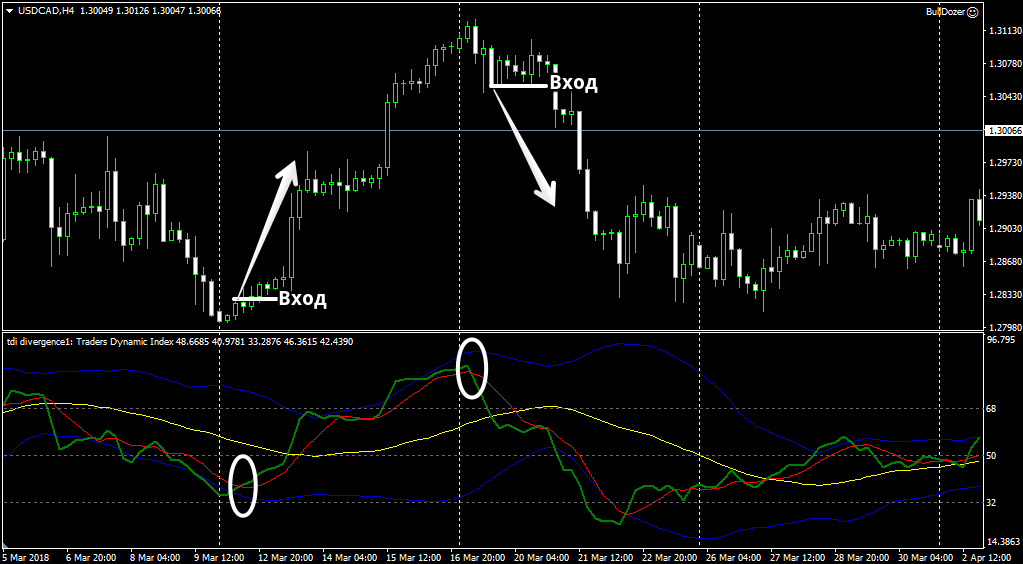
TDI also does a great job of capturing divergences on the chart, which in turn are one of the strongest reversal signals. It's worth noting that you can enable the display of divergences both on the chart and in the indicator itself in the settings, allowing you to avoid missing such signals. Here's a quick example:

When trading, be sure to pay attention to the blue Bollinger Bands, which are plotted not along the price, but along the RSI indicator.
First, pay attention to the width of the displayed channel, as the narrower it is, the lower the volatility and market activity.
Furthermore, if the lines extend beyond their boundaries, this may indicate a strong deviation, which could lead to the development of a new trend or a return of the price to a certain average value.
In summary, it's safe to say that the Traders Dynamic Index is one of the most successful and frequently used hybrids of standard indicators. Its functionality allows it to solve a variety of problems; in fact, even on its own, this tool can replace an entire trading strategy.

