LeMans Variation: Market Signal Source
Any trading strategy cannot do without its most important element – a signal indicator.
For this role, as a rule, all kinds of oscillators or custom tools based on them are used.
The LeMan Variation indicator is a technical analysis tool that belongs to the category of oscillator indicators.
It's worth noting that the LeMan Variation indicator is a unique development, as its creator didn't use standard tools during its creation, but implemented his idea from scratch.
Like all indicators belonging to the oscillator group, LeMan Variation can be safely used on absolutely all time frames, and it demonstrates particularly high efficiency on small time frames, which are most often used when scalping.
Installing the LeMan Variation indicator
Unfortunately, not all custom indicators that are in high demand and popular among traders are included in trading platforms by default.
The LeMan Variation indicator is no exception, so to use it in practice, you will need to download the indicator file at the end of the article and then install it directly into your trading platform.
The procedure for installing the LeMan Variation indicator is no different from installing any other custom indicator in the MT4 trading terminal. Specifically, you will need to copy the previously downloaded indicator file to the appropriate folder in the terminal's data directory.
You can find more detailed instructions on installing custom technical analysis tools by following the link http://time-forex.com/praktika/ustanovka-indikatora-ili-sovetnika.
After updating the trading terminal in the navigator panel or restarting it, LeMan Variation will appear in the list of custom indicators. To use the tool in practice, simply drag the indicator name onto the chart.
After applying the tool, you will receive the following work schedule:
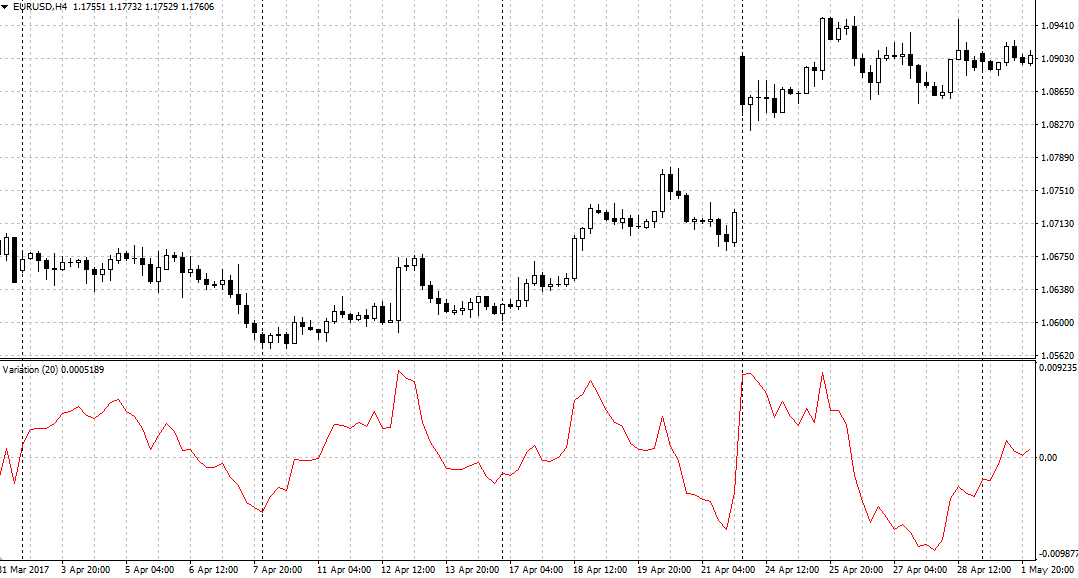
The principle of using the LeMan Variation indicator
The author of the LeMan Variation indicator pointed out that this oscillator is a trend instrument, and therefore it can perform two functions, namely a signal and a filter.
When it comes to the filter's function, it's worth noting that the indicator line moves in two trend planes, with the central line acting as a sort of equator. If the line is above 0, the trend is bullish, and if the indicator line is below 0, the trend is bearish.
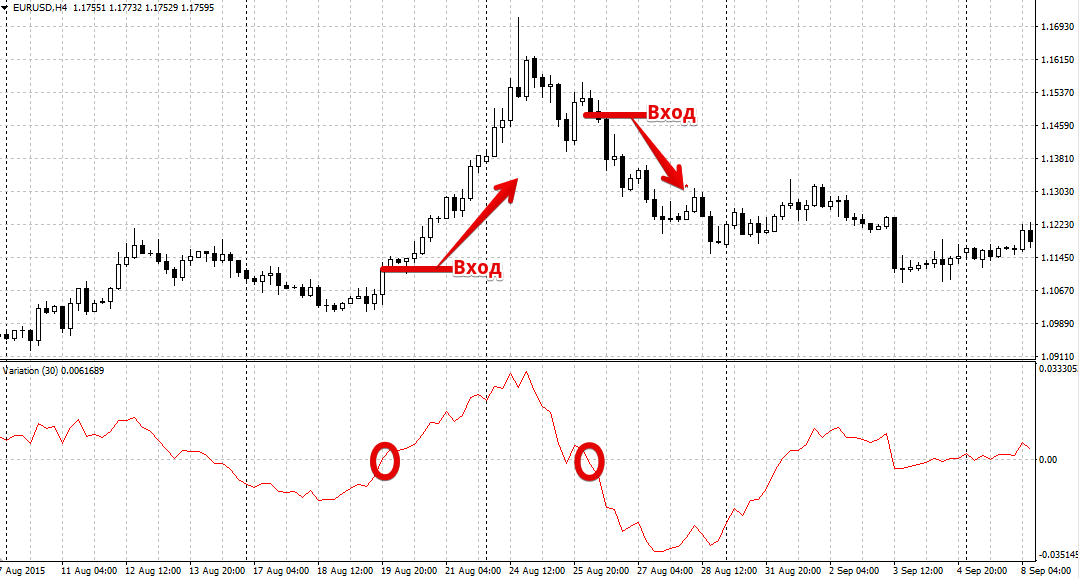
If we talk about the signal function of the instrument, then signals to enter the market occur when crossing the zero mark, which marks a change in the global trend.
So, if the indicator line crosses level 0 from the bottom up, we open a buy position. If the indicator line crosses level 0 from the top down, we open a sell position. Example:
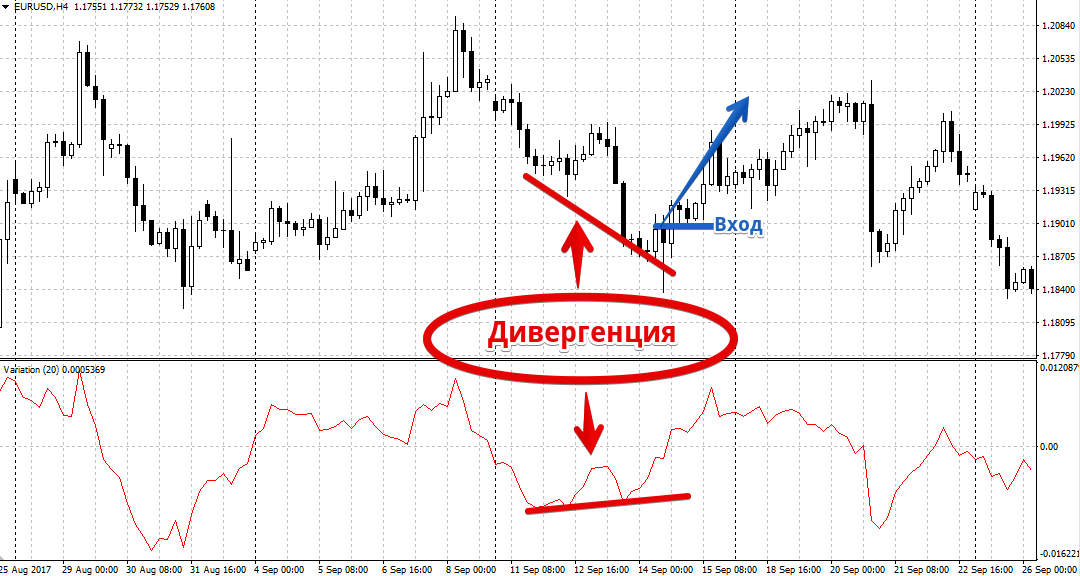
The second type of signal that presages a premature price reversal is called divergence. Divergence refers to the discrepancy between the indicator lines and the actual price movement.
So, if the price has updated a new price maximum, and the indicator line fixes it as lower than the previous one, we open a sell position.
If the price makes a new low and the indicator line registers it as above the previous low, open a buy position. You can see an example of LeMans Variation indicator divergence below:
In conclusion, I would like to note that the LeMan Variation indicator is a universal tool, but for its effective use it is necessary to combine the indicator with other tools technical analysis.
Download the LeMan Variation indicator.

