Multi-Williams Percent Range
A trend, as a market condition, is a fairly clear and at the same time abstract concept.
The fact is that each trader's trend may differ depending on the time frame they're using. It's no secret that a one-minute chart displays one picture, while a four-hour chart displays a completely different one.
However, the most interesting thing is that both traders can be confident that they're seeing the correct trend or signals within their strategy.
This is why traders often confirm signals or trend directions on a higher time frame, especially when trading intraday.
Of course, constantly switching between time frames when a signal appears on the primary time frame is quite inconvenient and time-consuming, which is why indicators with the "Multi" prefix are becoming increasingly common.
The Multi-Williams Percent Range indicator is a technical analysis tool that allows you to monitor Williams Percent Range indicator data from three time frames simultaneously.
A nice feature of this particular tool is the ability to set the required time frames for the trader, rather than having to monitor the chart intervals set by the developer.
It is worth understanding that the Williams Percent Range, like other oscillator tools, can be applied to all types of trading assets, be it currency pairs, stocks or CFD.
Oscillators also demonstrate high efficiency across all types of trading assets, making this tool useful for all traders, regardless of their trading style.
Installing the Multi-Williams Percent Range indicator
The basic version of the Williams Percent Range was created by Larry Williams back in 1973 as a kind of analogue of the stochastic oscillator, which was gaining immense popularity among traders at the time.
Multi-Williams Percent Range is a custom development for the MT4 trading platform, which you can use by downloading and installing the file at the end of this article.
Installing the Multi-Williams Percent Range indicator is no different from installing any other custom indicator and follows the standard procedure. Specifically, you'll need to copy the indicator file you downloaded at the end of this article to the appropriate folder in your terminal's data directory.
You can find more detailed instructions on installing indicators in the trading terminal by following the link http://time-forex.com/praktika/ustanovka-indikatora-ili-sovetnika.
You can also install the Multi-Williams Percent Range indicator through the Market. To do this, go to the "Market" tab in your trading terminal's "Tools" panel, then use the search function to find the indicator and install it automatically.
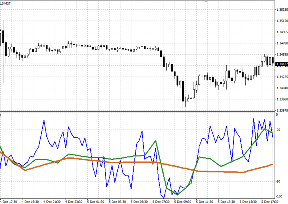
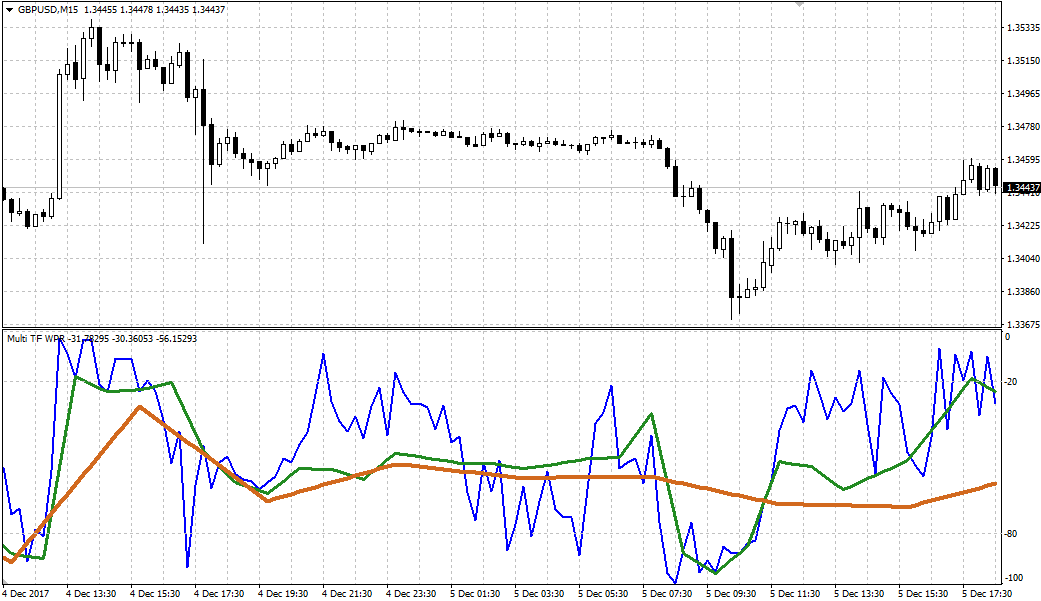
Once the Multi-Williams Percent Range is plotted on a chart, it will look like this:
Multi-Williams Percent Range Application Principles. Settings.
When you apply the tool to a chart, you'll see three lines in the additional area. The blue line represents the 15-minute chart, the green line represents the hourly chart, and the yellow line represents the four-hour chart.
Using Multi-Williams Percent Range is no different from any other oscillator, including the Williams Percent Range, except that traders can monitor the situation across three time frames simultaneously.
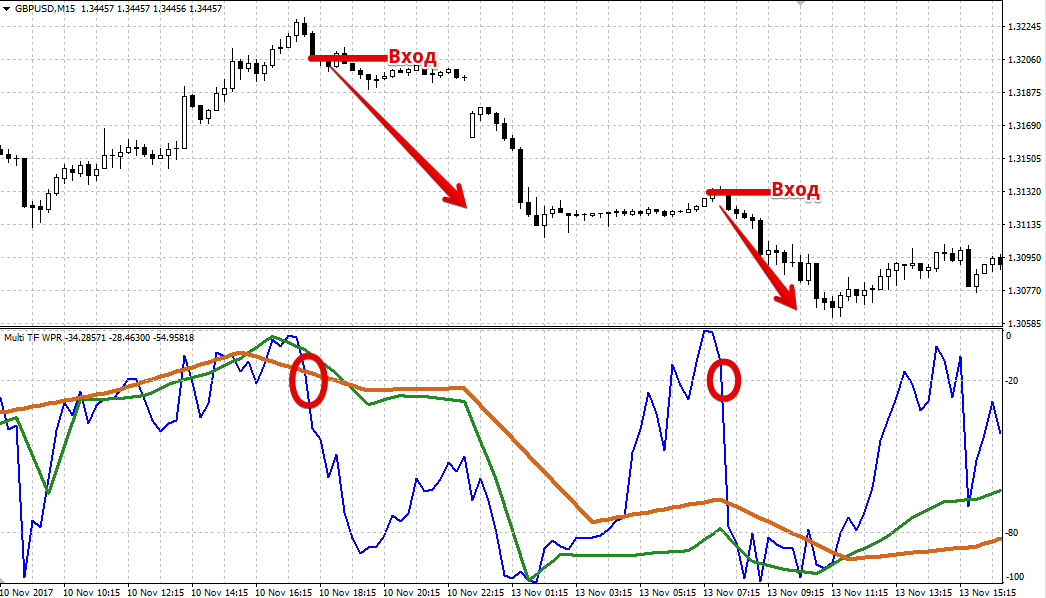
The first and most popular signal type is trading when the lines exit the overbought and oversold zones.
So, if one of the three lines drops below 80 and then crosses it upwards, open a buy trade. If the indicator line rises above 20 and crosses it downwards, open a sell position.
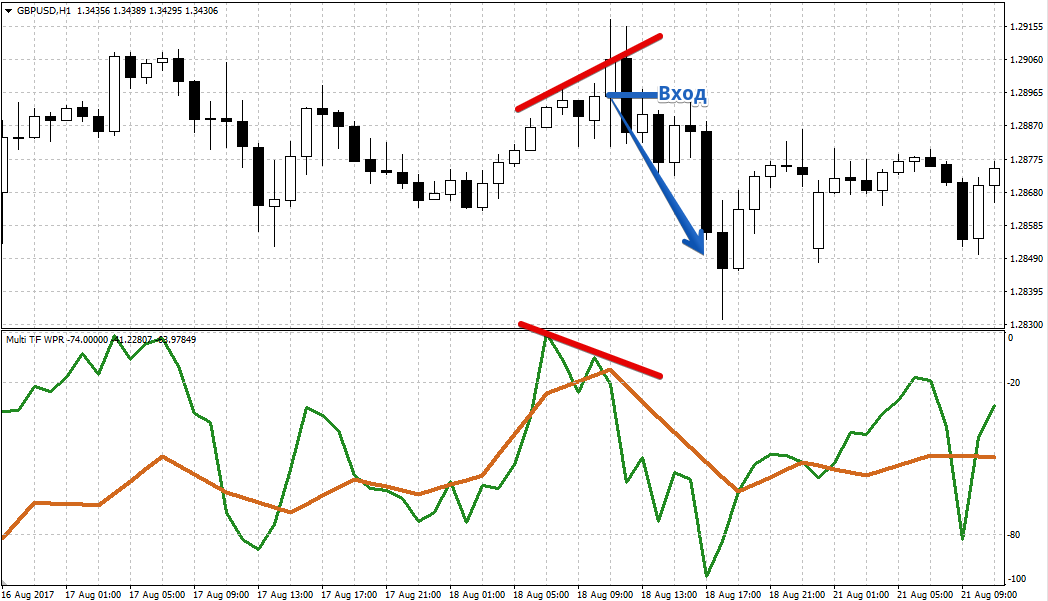
The second type of signal, which is both leading and reversal, is called divergence. The signal essentially occurs when a discrepancy appears on the chart between the formation of actual peaks and troughs and the formation of identical price movements by the indicator line.
Therefore, if the price has reached a new high, and the indicator line for the time frame in question shows it as lower than the previous one, open a sell position.
If the price has reached a new low, and the indicator line in question shows this peak as higher than the previous one, open a buy position. Example:
In the indicator settings, you can specify the time frame for each of the three lines in the Timeframe 1, 2, and 3 rows, but the indicator period is shared and is set in the Period row.
Finally, it's worth noting that Multi-Williams Percent Range is more convenient than the standard Williams Percent Range, as it allows you to monitor market conditions in a single window across three time frames simultaneously.
Download Multi-Williams Percent Range

