Available indicators for gold trading in MetaTrader 4
Gold is one of the most popular instruments for stock trading, and thanks to the fact that the asset is available on the MetaTrader trading platform, almost any strategy can be applied to it.

Most traders prefer to use fundamental analysis when trading gold based on the factors that influence the price of gold.
However, the best trading results can be achieved by combining fundamental and technical analysis, so when trading precious metals, using indicators from the MT4 trading platform is entirely justified.
MetaTrader offers a variety of indicators that can be used for gold trading, but we'll focus on three that complement each other.
Recommended indicators for gold trading
The advantage of the described tools is that their effectiveness has been tested over time and they are available by default in any MT4 trading platform
Moving Average Convergence Divergence (MACD)
The MACD is one of the most popular indicators for Forex trading. It measures the difference between two exponential moving averages and displays it as a line on the chart. The MACD can be used to identify trends and determine market entry and exit points.
Signals for opening trades:
Buy signal: MACD line starts moving up
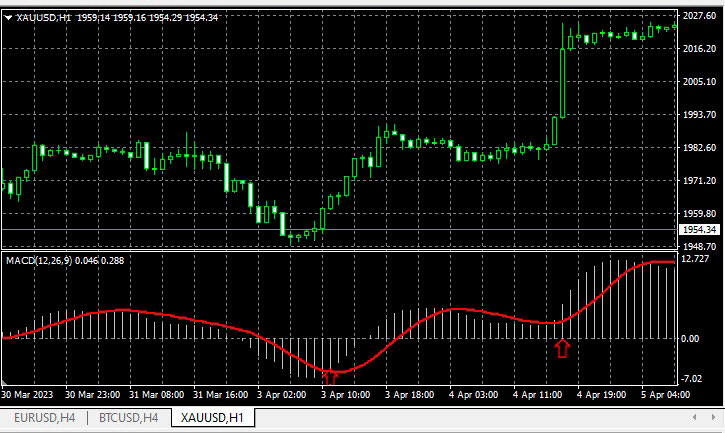
Sell signal: MACD line is moving downwards
The indicator's histogram serves as an auxiliary tool; changes in its length confirm a change in the existing trend.
MACD Operating Principles and Settings - https://time-forex.com/indikators/indikator-macd
Stochastic Oscillator
The Stochastic Oscillator measures the ratio of the closing price to the range price and displays it as a line on the chart. The tool is used to identify overbought and oversold zones, as well as to determine entry and exit points.
Signals for opening trades:
Buy signal: Stochastic Oscillator is in the oversold zone and is leaving it upwards.
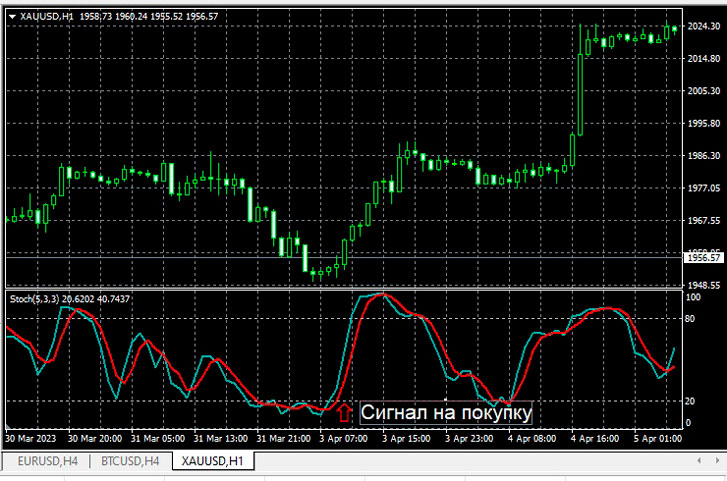
Sell signal: Stochastic Oscillator is in the overbought zone and is leaving it downwards.
For example, if the price of gold is in an uptrend and the Stochastic Oscillator is in the oversold zone, this is a signal to buy gold. If the price of gold is in a downtrend and the Stochastic Oscillator is in the overbought zone, this is a signal to sell gold.
Additional trading tips for using the Stochastic strategy - https://time-forex.com/strategy/strategiy-stohastik
Relative Strength Index (RSI)
The RSI measures the strength of relative price movement and displays it as a line on a chart. RSI can be used to identify overbought and oversold zones, as well as to determine market entry and exit points.
Signals for opening trades:
Buy signal: RSI is in the oversold zone and is moving upwards.
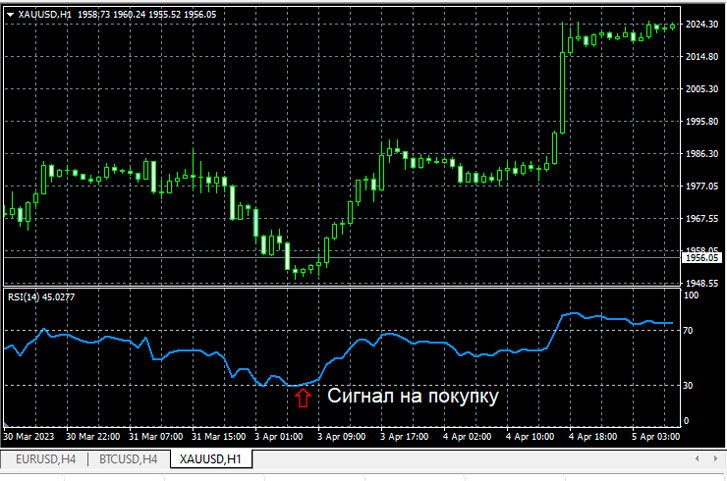
Sell signal: RSI is in the overbought zone and is moving downwards.
For example, if the price of gold is in an uptrend and the RSI is in the oversold zone, this is a signal to buy gold. If the price of gold is in a downtrend and the RSI is in the overbought zone, this is a signal to sell gold.
A detailed description of the RSI-based strategy is available at https://time-forex.com/strategy/st-rsi
If you wish, you can simultaneously install three of the listed tools on the chart or use such an interesting tool as Ultra Wizard
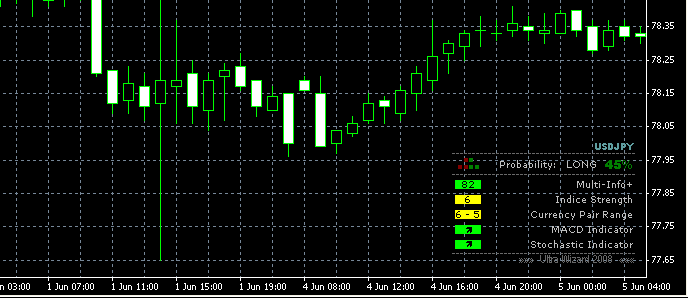
However, you must first download it from our website and then add it to MT4. Ultra Wizard visualizes the operation of several indicators at once, making trading more convenient.
When choosing tools, it's important to consider your personal preferences and trading style. It's also important to remember that scripts aren't foolproof and don't guarantee profit.
When trading precious metals, you may also find the following information useful:
Gold broker spread size – https://time-forex.com/vsebrokery/brokery-zoloto-serebro
Is scalping possible on precious metals? – https://time-forex.com/skalping/skalping-na-zolote
How swap rates affect long-term gold trading - https://time-forex.com/info/swop-gold

