Forex Profit Strategy
Following the trend remains the top priority for almost every trader. A clearly directional market, also known as a trending market, can generate very high returns for all traders who follow it.

However, despite understanding the meaning of a trend and how to use it, most traders experience significant difficulties identifying it and finding entry points.
For this purpose, trend indicators are commonly used, which, with a slight delay, yet clearly determine the market direction.
The Forex Profit strategy is a trend-following tactic based on two trend indicators, the Moving Average and Parabolic SAR, and is designed for trading any currency pair.
A specific feature of trend strategies is that they only perform well on higher time frames, but Forex Profit can also be used on a minute chart with minimal adjustments to the indicator settings.
Setting up the Forex Profit strategy
can be used in any trading terminal, as the Moving Average and Parabolic SAR indicators are standard and present in any professional trading application. To build the strategy, apply three exponential moving averages (EMAs) to the chart: periods of 10, 25, and 50, each in a different color.
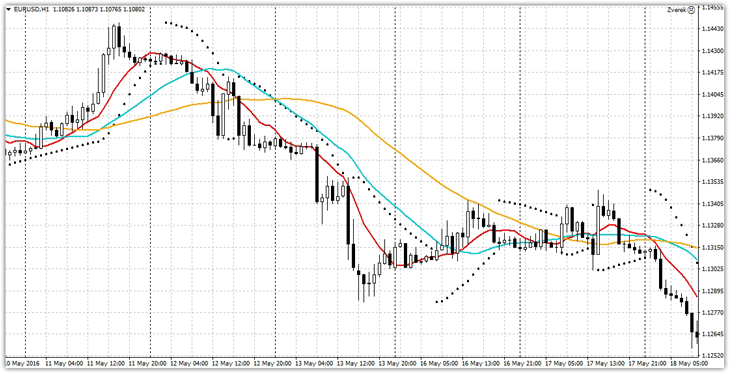
Also, if you're using the MT4 trading platform, we recommend downloading two strategy templates at the end of this article. Once installed and launched, all indicators will automatically appear on the chart. After downloading the template, go to the terminal's data directory and place it in a folder named Template. After restarting the platform, open the additional menu on the chart by clicking it and select the Forex Profit template. After launching, you'll see a chart like this:
Forex Profit Strategy Signals
The Forex Profit strategy uses a dual-screen system, but not in the classic sense, where a signal from a short-term trend should correspond to a long-term one, but vice versa. This way, we'll confirm a signal from the hourly chart on the 15-minute chart. So, on to the signals.
Buy signal:
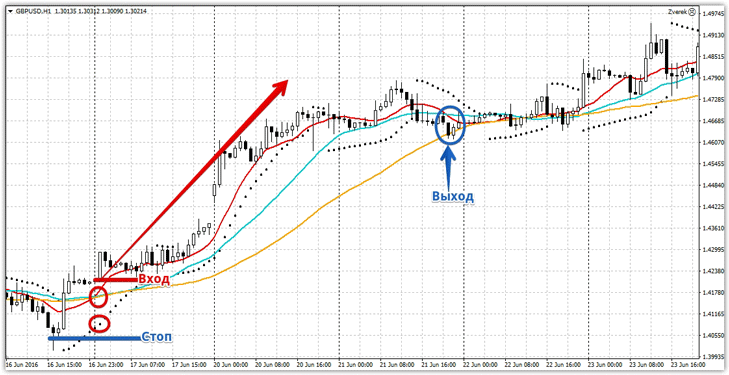
1) The 10-period moving average crosses the 25- and 50-period moving averages from bottom to top.
2) At the moment of the crossover, the Parabolic SAR indicator point is below the price.
A stop order should be placed at a local minimum or a couple of pips from the 50-period moving average. Position trailing occurs along the 50-period moving average, and the position should be exited if the price crosses all three lines in the opposite direction to the signal.
Before opening a position, be sure to switch to the 15-minute chart. When a buy signal occurs, the Parabolic Sar dots should be below the price.
A sell signal:
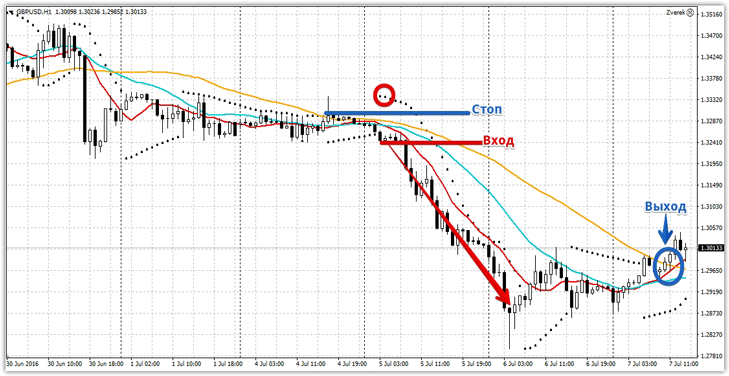
1) The 10-period moving average crosses the 25- and 50-period moving averages downwards.
2) At the moment of intersection, the Parabolic Sar dot is above the price.
It is very important to limit risks at the local maximum or at the Parabolic Sar dots. The trade is exited at the moment of the reverse intersection of the three moving average lines. Also, before entering the market, you should check the location of the indicator dots on the 15-minute chart; specifically, at the moment of the signal, the dots should be above the price. Entry example:
Using the Forex Profit strategy for scalping.
In addition to using the Forex Profit strategy for trend trading, it can also be used for scalping on a minute chart. To do this, change the moving average periods from 10, 25, and 50 to 25, 50, and 100, and the Parabolic SAR indicator unchanged. Now the strategy is ready for scalping, and we can move on to the signals.
Buy signal:
1) The price crosses three moving average lines from the bottom up and closes behind them.
2) At the moment of the crossover, the Parabolic SAR indicator point is below the price.
Market entry occurs on a closed candle. The profit for scalping is static – 10 pips. A stop order should be placed at the local minimum or at the minimum of the signal candle. Example:

Sell signal:
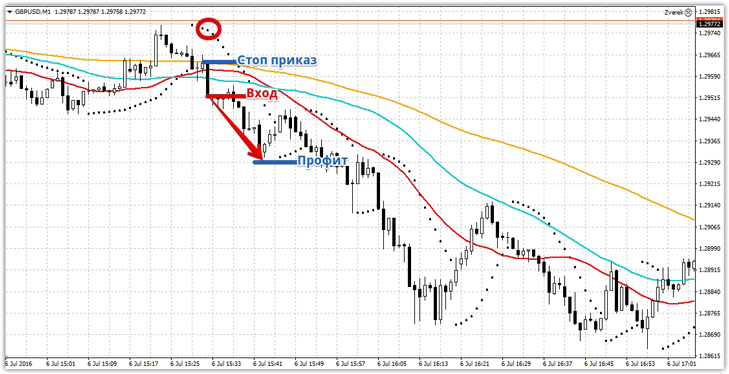
1) The price crosses three moving average lines from top to bottom and locks behind them.
2) At the moment of the crossover, the Parabolic SAR indicator dot is above the price.
A stop loss is placed beyond the candle's high, with a profit of 10 pips. Example:
In conclusion, it's worth noting that the Forex Profit strategy is a versatile tactic and can be used for both trend-following and scalping. However, like any tactic, Forex Profit has its weaknesses.
For example, if you decide to use the strategy on hourly charts to follow a trend, you may receive many false signals during flat trading. When it comes to scalping, you should be extremely cautious when trading on the news, as you may be repeatedly hit by stop orders due to high volatility.
Download the necessary scripts.

