Strategy on the sma indicator
The simple moving average is one of the most effective technical analysis tools, used by most traders to determine both the trend direction and market entry points.

The moving average is one of the oldest technical analysis indicators and is used on virtually every exchange.
Naturally, the SMA as a standalone tool cannot demonstrate the effectiveness a trader expects from it.
Despite the SMA's versatility, it cannot capture all the nuances of market volatility, so a strategy based on the SMA indicator with additional filters is the optimal solution.
The SMA indicator strategy we'd like to share with you combines SMA and trend detection with the money supply and volume that underpins a given price action. You'll probably immediately object, saying there's no volume in the Forex market!
You're partly right, but no one has abolished tick volume, which is also very informative for currency speculators. The strategy itself can be applied to any currency pair, but the SMA-based tactic is designed for medium-term traders, since all trading is conducted on the daily chart.
The choice of such a high time frame for the strategy is explained by the lower amount of market noise, which is simply necessary for trend-following strategies.
Transferring the SMA strategy to the chart
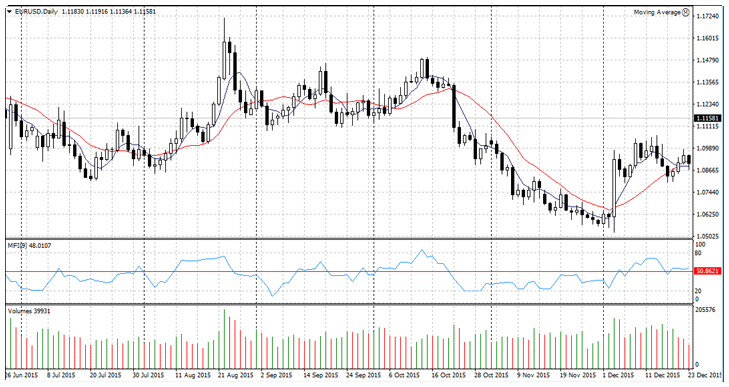
To build a strategy on a chart in almost any trading platform, apply 2 SMA indicators with periods of 5 and 14 in different colors, as well as standard volume indicators Money Flow Index with a period of 9 and the Volume indicator with default settings.
If you prefer trading using the time-tested Meta Trader 4 trading platform, we've prepared a special template for you, which you can download for free at the end of this article. To install the template in the platform, go to the trading terminal's File menu and open the "Data Catalog.".
Once you've accessed the system files directory, find the folder named "Template" and copy the downloaded template into it. After you close the terminal's root directory, go directly to the platform and update it in the navigator panel.
After updating the terminal, open the daily chart of any currency pair and right-click to open the special menu and go to the Templates section. Select "SMA Strategy" from the list that appears.
Trading signals
When using the strategy, it is crucial to wait for the candle to close, as if the situation changes by the end of the day, the signal may be canceled, and the loss on this time frame will naturally be substantial.
Buy signal:
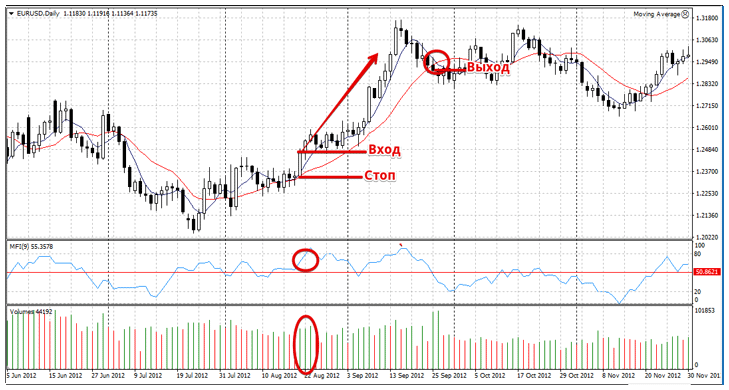
1) The market trend changes from a downtrend to an uptrend, namely, the 5-period SMA crosses the 14-period SMA from below!
2) At the moment of the SMA crossover, the Money Flow Index should either be above 50 or crossing it from below.
3) The Volume indicator shows an increase in tick volume compared to the previous candle.
When entering the market, it is very important to limit risks, namely, set a stop order at the low of the signal candle or at a local low. The choice of stop order placement depends on the market situation. The market exit occurs when the SMA crosses back or the price has moved two stop order distances. Example:
Sell signal:
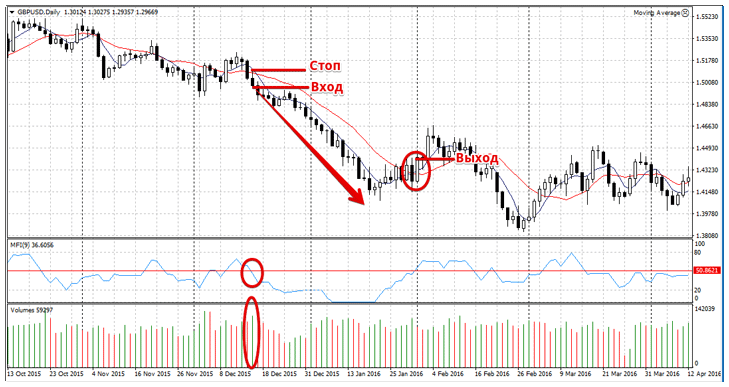
1) The market trend changes from up to down, specifically, the 5-period SMA crosses the 14-period SMA from top to bottom.
2) At the time of the SMA crossover, the Money Flow Index must be above 50 or crossing it from top to bottom.
3) The Volume indicator shows an increase in tick volume compared to the previous candlestick.
Limit losses with a stop order either at the local maximum or at the maximum of the signal candlestick. Exit the market when the moving averages cross back. Example:
In conclusion, it's worth noting that the SMA indicator strategy discussed in this article has a wide range of filters that reduce the number of false signals during flattrading, while the potential profit-to-loss ratio is significantly more positive and complies with all capital management laws.
Download the SMA template

