Fork Strategy for Forex
One of the most common mistakes beginners make when developing strategies is going to extremes. 
This occurs when they adhere to one type of analysis and completely ignore the advantages of another, which inevitably leads to a strategy consisting either solely of technical indicators or entirely of chart patterns.
However, the market isn't so simple and straightforward that it can be easily predicted, so more experienced traders use several different strategies in their trading.
They also employ strategies that are essentially built on a symbiosis of technical and graphical analysis. You'll learn about one such strategy in this article.
The "Fork" strategy is a unique trading method designed to generate profits by trading with the global trend during pullbacks.
The "Fork" strategy is essentially a graphical tactic, so it can be used on any currency pairs and even CFDs.
There are also no restrictions on its use on specific time frames, but experience shows that Andrew's Pitchfork is more effective with minimal market noise, meaning it's best used on a daily chart.
It's worth noting that this strategy isn't recommended for beginners, as it requires experience with graphical tools.
Preliminary Preparation and Template Installation:
As we've already noted, the "Fork" strategy is essentially based on graphical and technical analysis.
Therefore, firstly, your trading platform should have Fibonacci tools and Andrew's Pitchfork, and secondly, it should have a stochastic oscillator. Both versions 5 and 4 of the trading terminal fully meet these requirements.
You can create the strategy yourself or use the template, which you can download directly at the end of the article.
To do this, you'll only need to apply one indicator to the chart – a stochastic indicator with standard parameters.
If you use a template, simply place it in the Template folder, which you can access directly from the File menu in the open terminal.
After installing the template, be sure to restart the platform or perform a simple terminal update using the additional menu in the Navigator panel.
Then, simply open the daily chart and run the Fork strategy template on it.
 Step-by-step strategy implementation algorithm. Signals
As we've already noted, "Fork" is a complex trading strategy that requires skill in using Andrew's Pitchfork and the Fibonacci grid.
Since the strategy doesn't require all conditions to be met simultaneously, but rather works by gradually building signals, we'll integrate each point into a single picture. So, let's get started.
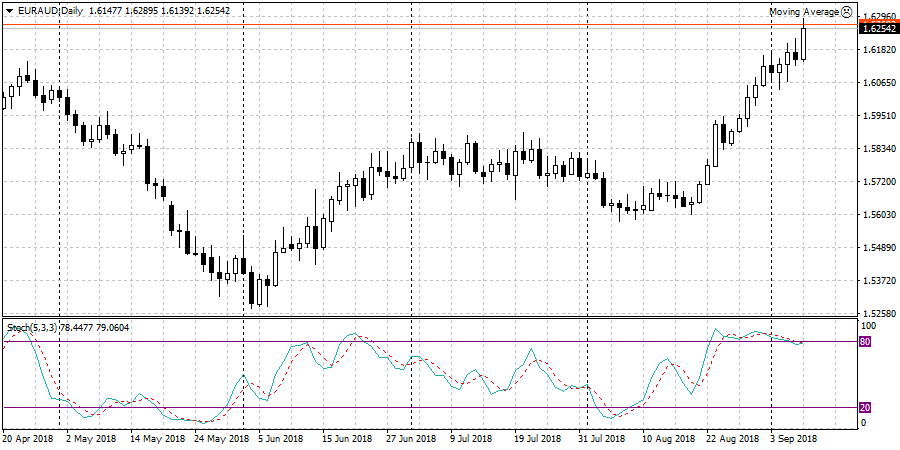
Conditions for opening a buy trade:
1. During an uptrend, wait for a pullback and draw a Fibonacci grid from the initial low of the trend to the point where the pullback. The key condition is that the price should not roll back below 61.8.
2. On the resulting downward pullback, draw Andrew's Pitchfork using three points. The first point is drawn at the local high where the pullback began. The second point is placed at the local low where the pullback stopped.
The third point is the local high that formed after the pullback but did not lead to a resumption of growth. It's crucial that the price remains above the middle line of Andrew's Pitchfork during a further pullback.
3. Draw a line through points 1 and 3, where you plotted Andrew's Pitchfork.
4. When the price breaks through the line drawn from bottom to top through points 1 and 3, open a buy position.
5. At the moment of the breakout, the blue line of the stochastic oscillator should be above the dotted line.
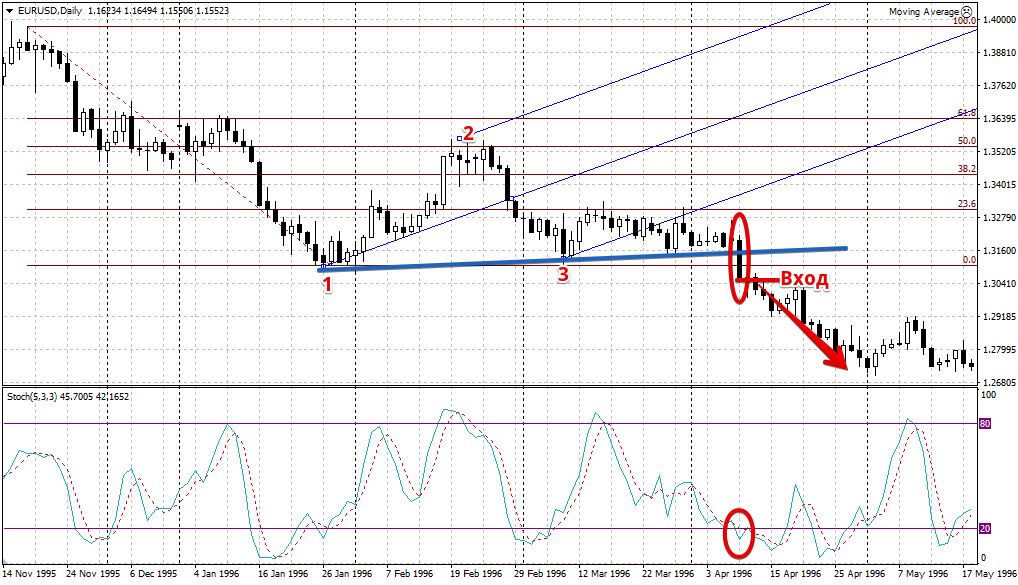
 Conditions for opening a sell trade:
1. During a downtrend, wait for a pullback and draw a Fibonacci grid from the high of the trend's inception to the point where the pullback begins. The key requirement is that the price should not revert above 61.8.
2. On the resulting upward pullback, draw Andrew's Pitchfork using three points. The first point is drawn at the local low where the pullback began.
The second point is placed at the local high where the pullback stopped. The third point is the local low that formed after the pullback but did not lead to a resumption of growth.
It is crucial that the price remains below the middle line of Andrew's Pitchfork during a further pullback.
3. Draw a line through points 1 and 3, where you drew Andrew's Pitchfork.
4. When the price breaks through the line drawn from top to bottom through points 1 and 3, open a sell position.
5. At the moment of the breakout, the blue line of the stochastic oscillator should be below the dotted line.
 In conclusion, it's worth noting that the "Fork" strategy may seem complex at first glance.
In fact, once you understand the rules for constructing graphical elements, using it in practice is much easier than you might imagine.
Download a ready-made template for the Fork strategy.

