Andrews' Pitchfork
Andrew's Pitchfork is a popular technical analysis indicator. It was developed by Alan Andrews.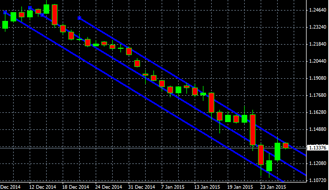
In everyday work, Andrew's Pitchfork helps traders identify periods of trend continuation and resistance in the forex market.
It serves as a tool for dividing the main channel into two equally spaced ones, allowing for a more complete trend analysis.
During an upward trend, the Andrew's Pitchfork chart uses three points:
• A significant increase in the trend;
• A significant decrease in the trend;
• A common point, which serves as the initial stage of the trend.
The most effective forex level indicators in practice
Price levels play a decisive role in choosing entry points into the market; they serve as the main guidelines for opening trades or as signals for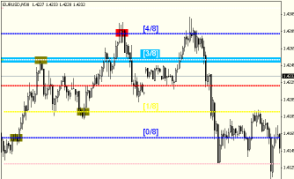 closing them.
If you wish, you can manually identify the most important ones, but it is easier to use technical assistants.
Forex level indicators are scripts that, based on historical price action and current quotes, identify the most significant levels on a chart.
There are many such technical tools, and in this article, we'll explore the most effective ones.
Types of Forex charts.
The bulk of technical analysis is based on Forex charts, which provide insight into price behavior.
Several chart types are available in a trader's trading terminal, and choosing the most appropriate one depends solely on personal preference and the objectives.
Forex chart types in MetaTrader 4 include line charts, bar charts, and Japanese candlesticks. Additionally, there are some general parameters that should be considered during analysis.
These parameters include:
Elliott Waves.
Crowd behavior is subject to certain laws and changes according to certain rules. Any freely traded asset is inextricably linked to the will of a large number of people, a kind of crowd. It would be logical to find patterns here as well and try to develop methods for successful trading.
This is precisely what accountant Ralph Nelson Elliott did at the beginning of the last century. Studying the bizarre movements of market prices, he concluded that the market, as a product of crowd psychology, has a unique, constantly repeating wave structure. Having established that the wave relationships in this structure obey Fibonacci proportions, Elliott created a subtle and timeless tool for analyzing commodity and financial markets.
What is the essence of this work? Elliott's basic patterns consist of impulse and corrective waves. An impulse wave has five smaller waves and moves in the same direction as the higher-order trend. A corrective wave ( forex pullback ) contains three subwaves and is directed against the trend. By connecting with each other, these structures form larger formations of the same figures, which, by combining, create even larger specimens... And this process is endless.
Stages of technical analysis of the Forex market.
Technical analysis of the Forex market involves studying the dynamics of exchange rate movements. This is why price charts for previous trading periods (timeframes) are used as its primary tool. Charts with timeframes ranging from five minutes to several years are used for analysis.
It's worth noting that charts with longer periods exhibit significantly less "market noise," or false movements. Therefore, they clearly show the prevailing trend lines, key chart patterns, and support/resistance levels. This allows for a relatively objective forecast of the most likely direction of exchange rate movements.
Experts in global Forex trading recommend conducting technical analysis every week before the start of the next five-day trading period. They divide this analysis into three stages.
Trend reversal: causes and signs.
Trend following has always been a priority in Forex trading. Simply open a trade and you're guaranteed a profit. This would be the case if not for the so-called trend reversal.
This is precisely the reason why most deposits are lost and the largest drawdowns occur. There can be many reasons for a reversal, but the result is always the same: losses.
Forex channel indicators, the most effective options.
In most cases, a Forex trend forms a clearly defined channel as it moves. Effective use of such channels can significantly improve your trading results.
By constructing a price channel, you get a virtually complete picture of the current situation—the direction of the current trend, the width of price fluctuations, the magnitude of the correction, and the minimum and maximum price levels.
Currently, almost all constructions are performed using channel indicators. We'll discuss their variations in this article, and links to download the scripts themselves will be provided.
Technical analysis tools.
In recent years, Forex trading using fundamental analysis has significantly lost its effectiveness, leading to the growing popularity of technical analysis tools. Technical analysis is the key method for studying market conditions, and the data obtained is used to make forecasts.
Technical analysis tools are anything that aids in technical analysis. This group includes indicators and oscillators, chart patterns, and standard visual analysis.
It's not necessary to use just one of these tools; a comprehensive approach has always yielded the best results.
Forex levels.
Levels are one of the main reference points when opening new Forex trades; they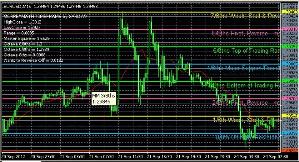 indicate the points on the chart that, when reached, may cause the price of a currency pair to change its behavior.
Forex levels are used in strategies such as breakout and reversal trading, price channel trading, and other options. The key is to choose the right level for your needs.
Commonly used levels in trading include support and resistance, pivot points, Murray levels, and other similar options.
Forex volume.
The concept of volume is quite common in technical analysis of financial markets; it is this indicator that serves as the main confirmation of an emerging or current trend.
Forex volume characterizes the number of transactions for a given currency pair, as well as the total value of trades concluded over a given period of time.
However, it's advisable to only consider volume changes over short timeframes, as this indicator doesn't always accurately reflect the current situation and can lead to erroneous actions.
Support and resistance lines.
The Forex market trend follows its own law: the price sometimes rises to a certain point, then falls. This creates so-called highs and lows, which characterize peaks and troughs on the price chart.
These points correspond to a specific time period, and each timeframe has its own unique and unique characteristics.
These highs and lows are used as the basis for constructing support and resistance lines, which require at least two points on the currency pair's chart.
How to determine a trend visually or using indicators
Trend trading is the basis of most strategies currently used in Forex, so one of the pressing questions is how to determine the trend, or more precisely, its direction over a given time period.
To more accurately understand this issue, you should clearly understand what a trend is and what its direction depends on, as well as understand some of the features of determining its movement.
First of all, it should be noted that the direction of the trend directly depends on the time period on which you conduct technical analysis.
That is, if a price increase was observed during the day, this does not mean that it grew continuously without significant fluctuations.
It is this aspect that plays a fundamental role in determining the price movement on the working timeframe.
Methods of technical analysis
There are several basic methods of technical analysis in the Forex market that allow you to assess the current situation. A novice trader should be familiar with all the available options before choosing the most suitable one.
You should begin your study with simpler and more straightforward concepts and then move on to more complex approaches.
The most complex market research method doesn't always yield the most accurate results and, consequently, the long-awaited profit.
All existing methods can be roughly divided into graphical, cyclical, channel, and level-based methods.
There are also other options for market research, but today we will focus on the ones listed above
Principles of technical analysis
Most novice Forex traders underestimate the role of technical analysis and begin trading purely on intuition. Only after initial failures do they move on to a more in-depth study of the theoretical foundations of analysis.
When beginning to learn the basics of technical analysis, it's important to understand the fundamental principles upon which it is based. There aren't many of them, so familiarizing yourself with them won't take much time.
The principles of technical analysis reveal its essence and make it possible to understand what you should pay attention to first.
Technical Analysis Plan
Conducting technical analysis requires a specifically designed action plan to ensure consistency and improve the process's effectiveness. A well-designed plan is the foundation of preparation for trading.
Methodological literature primarily describes the methods and techniques of various types of market analysis, but neglects to address how to apply this knowledge in practice.
A Forex technical analysis plan depends on the specific market analysis method you choose for your trading strategy, but there are still common components to any plan.
Minimum and maximum points in Forex
The exchange rate always moves along a curve; at each time interval, key minimum and maximum points can be identified; they characterize the minimum and, accordingly, maximum price levels on a given time frame.
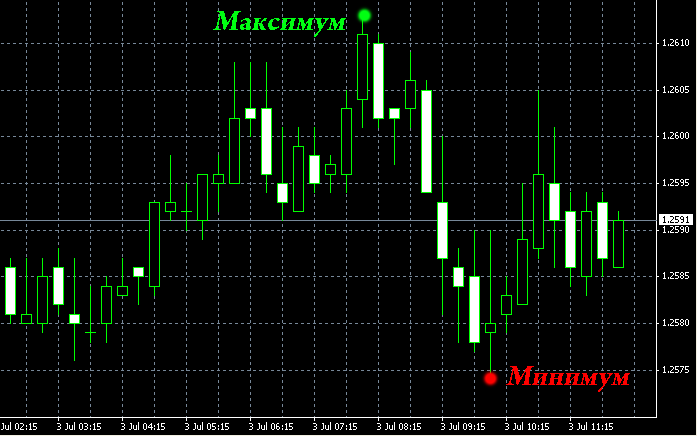
The significance of these indicators is quite important, since these points serve as the basis for constructing price channels and are used in many Forex strategies.
It also serves as a basis for conducting in-depth technical analysis.
For example, the minimum price for the EUR/USD currency pair during the day was 1.2574, that is, the price did not fall below this value during the day.
Minimum and maximum points serve as key benchmarks when developing many Forex trading strategies, so the effectiveness of your overall trading directly depends on their correct determination.
Page 3 of 4

