What is a liquidity zone and how to determine a liquidity zone in trading?
The liquidity zone is an area on the chart where a large number of market participants' orders are concentrated: stop losses, pending orders, and limit positions.

It's precisely in these areas that market participants' money is concentrated. This happens because most traders think alike and place orders at roughly the same points.
For example, some people take profits at round levels, others place stops at highs and lows, and others open breakout trades.
When the price approaches such zones, a large number of orders begin to trigger simultaneously, and the market reacts sharply.
A momentum occurs, which often looks like a strong move up or down.
Example: Cryptocurrency Liquidity Zone - Bitcoin
There may be a large number of sell orders before the 100,000 level, as many consider it "strong resistance." And immediately after, for example at 101,000, buy orders accumulate—traders believe the level has been broken and the price will continue to rise.
In gold (XAU/USD), liquidity forms near strong historical levels and extremes. In the forex market, these are local highs and lows, where most traders place stop-losses.
Understanding liquidity zones provides a major advantage: you begin to see where the price is most likely to go and why it is going there.
Liquidity zone on the chart and how to determine the liquidity zone
The liquidity zone isn't directly displayed on the chart—you have to be able to "read" it. It most often forms in three key locations.
- First, behind the highs and lows. That's where traders place stop orders, meaning that's where the money is concentrated.
- Secondly, in sideways movements (flats), where accumulation of positions occurs.
- Thirdly, in places of sharp reversals, where the market has previously shown activity from major participants.
To identify a liquidity zone, pay attention to price behavior. If the price repeatedly approaches the same level but fails to break through, liquidity is almost always accumulating behind that level. When a breakout occurs, you can often see a sharp movement—this is a stop-loss event.
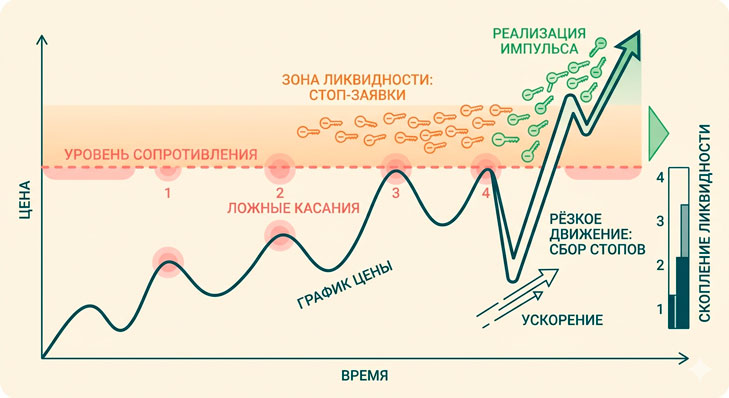
A very important point: after liquidity has accumulated, the price often reverses. This is a classic situation where the market has "fooled" the crowd and moved in the opposite direction.
Thus, the liquidity zone is not a line, but rather a range in which orders are concentrated.
Indicators to help you determine your liquidity zone in MetaTrader
While liquidity is best determined by "reading a chart," there are tools that help visualize such zones.
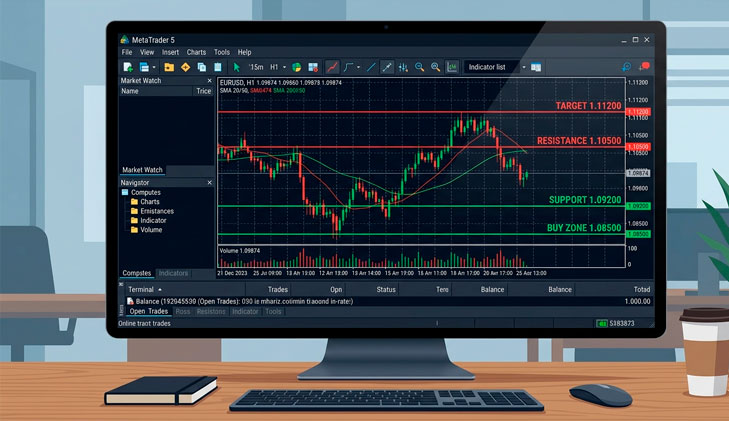
In the MetaTrader platform (MT4/MT5), the main tools for determining liquidity zones are indicators and level construction.
The point is that any liquidity zones are directly linked to support and resistance levels—that's where market participants' orders accumulate.
Simply put, levels are places where the market has reacted before, meaning there will be orders there again. This is why liquidity zones form around these levels.
In MetaTrader the following are used for this:
Volumes (Tick Volume) - shows market activity; volume spikes often coincide with liquidity zones
Fractals help find local highs and lows, behind which stops are usually located
Level indicatorscollected here - https://time-forex.com/tehanaliz/indikatory-urovney-forex
It is important to understand that a level is not a precise line, but a zone where the price has already stopped or reversed several times.
So, to put it simply: the liquidity zone is the area around a strong level, where orders are concentrated and the main battle between buyers and sellers occurs. There are solutions there that help identify entry levels and zones.
Trading strategy using liquidity zones
Liquidity trading is based on a simple idea: the market first follows stops, and only then follows the main movement.
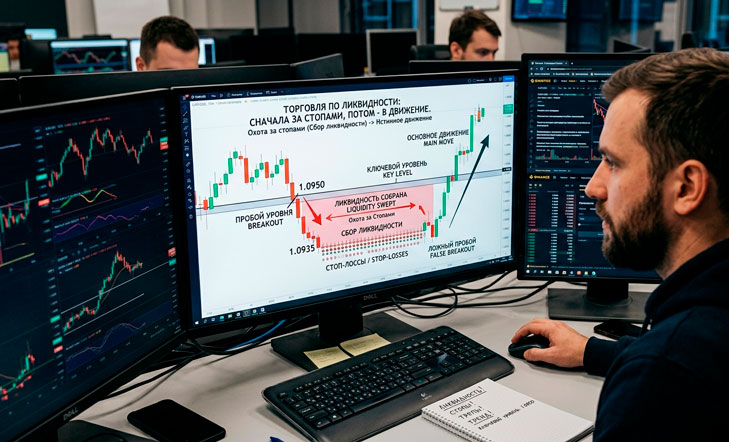
One of the most effective approaches is as follows. First, a key level (such as a high or low) is identified. Then, the trader waits for the price to break through this level and accumulate liquidity. At this point, most participants enter the market in the direction of the breakout.
But this is where false breakouts. After the stops are met, the price reverses—and this is an entry point for more experienced traders.
The logic of the deal:
- the price breaks through the level
- a sharp impulse occurs (collection of liquidity)
- a reversal signal is being formed
- the entrance is in the opposite direction
Stop-loss orders are typically placed beyond the liquidity zone's extreme, and take-profit orders are placed in the direction of the main movement. This approach allows you to trade alongside major market participants rather than "with the crowd.".
The liquidity zone is key to understanding price movement, as it is where the real market capital and the interest of major players are concentrated. Knowing how to identify these zones and use them correctly can significantly improve the accuracy of your entries and avoid the common mistakes of most traders.

