BB MACD indicator
Creating your own trading strategy is in many ways like playing with a construction set, where each 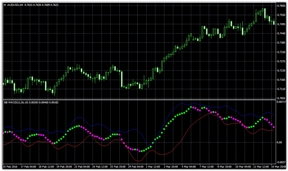 block has its own purpose, and the whole of them creates a complete structure.
By creating a strategy, you as a trader combine all the positive qualities of certain indicators and at the same time offset the negative ones, which will ultimately help you achieve your goals.
However, the vast majority of beginners begin, to put it mildly, to exaggerate the importance of having various indicators in a strategy, which is why we can see charts cluttered with dozens of necessary and unnecessary indicators.
This is especially noticeable when a trader tries to create a trading strategy from standard indicators, where, as a rule, 1 indicator is responsible for one direction.
The BB MACD indicator is a technical analysis tool that combines the properties of two of the most popular indicators among the trading community, namely the MACD and Bollinger Bands.
When you first look at this indicator, you wouldn't even guess that it contains MACD, but if you connect these two instruments on a chart and look at their signals, in most cases they will be identical and appear simultaneously.
The tool can be used on any currency pair and any time frame, but due to the indicator's clear trend component, the best time frames for BB MACD are thirty-minute and hourly charts.
Setting up BB MACD
BB MACD is a custom indicator that is never included by default in any trading platform. Therefore, to use it, you must first download the file at the end of this article and install it on the MT4 trading platform. To do this, open the platform and go to the File menu and open the data directory.
By entering this directory, you gain access to the platform's system folders, so we drop our previously downloaded indicator into the indicators folder.
To add the tool to your custom indicator list, simply restart the terminal or update the files in the Navigator panel. After installation, drag the tool onto the chart.
Indicator signals
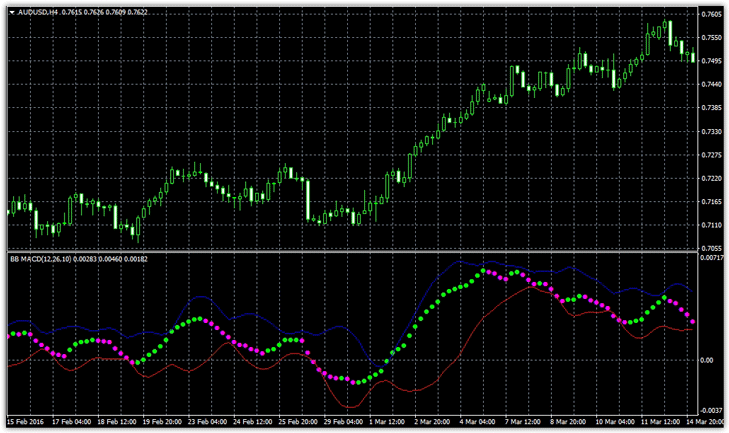
As mentioned, the BB MACD has incorporated key features of two indicators, namely the MACD and Bollinger Bands. From the Bollinger Bands, the indicator takes its ability to measure market volatility and trend strength. To achieve this, the indicator uses two red and blue lines, which create a kind of channel.
If you see a wide channel, you're looking at a strong trend with high volatility. If the channel around the indicator lines has narrowed significantly, the trend has entered a sluggish phase and is moving sideways.
However, you should clearly understand that any channel compression leads to a strong surge, just as a spring would if you tried to compress it as much as possible. Therefore, a narrow channel should warn you of an imminent strong surge, not a weak trend.

The second type of signal occurs based on the MACD principle, namely, when the dots cross the 0.00 level. If the dots are above the signal line, the global trend is upward. If the dots are below the signal line, the global trend is downward.
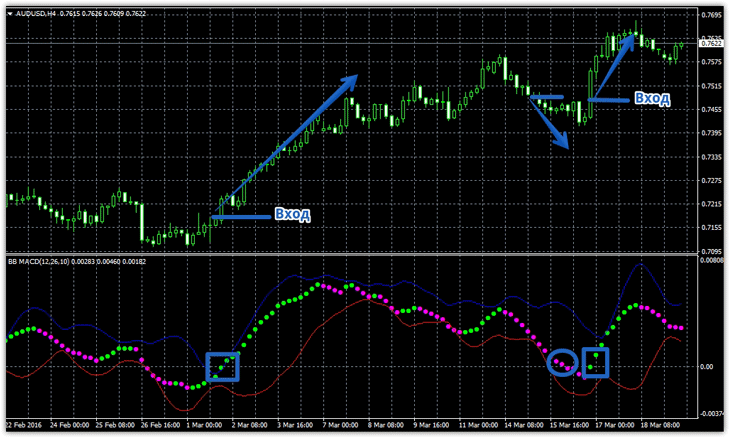
A change in the global trend is when we enter a position. Specifically, if the dot appears above level 0, we buy, and if the dot appears below level 0, we sell. See the example below:
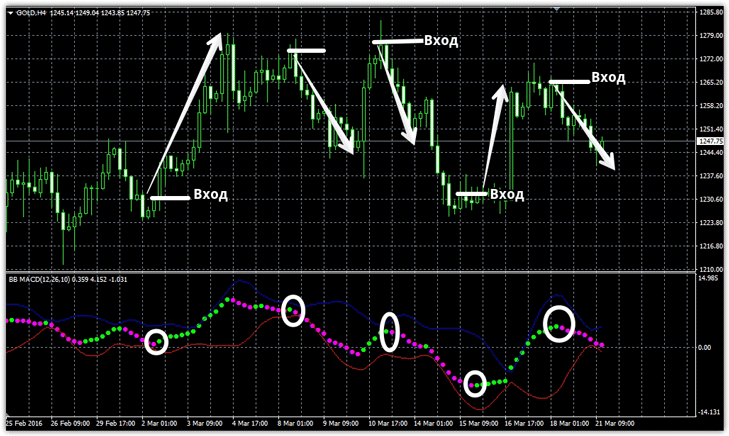
The third type of signal is based on the indicator's own dots. Every trader knows that, in addition to the global trend, the market also has a so-called micro trend, which, when combined, paints a clear picture.
While a global trend lasts for a long time, a micro trend is shorter-term. The BB MACD indicator uses the color of its dots to represent the short-term trend: green dots indicate an uptrend, while pink dots indicate a downtrend.
When a dot changes color, a buy or sell signal is generated. Example below:
In conclusion, it's worth noting that the BB MACD displays micro trends more clearly than the standard MACD and can easily replace the standard indicator. However, in terms of channel properties, its functionality is insufficient to eliminate the need for Bollinger Bands , as can be done with the MACD.
Download the BB MACD indicator.

