Scalping on pullbacks
Scalping, like any trading tactic, involves finding market entry points. Everyone has  their own approaches to finding these points, but generally, it all comes down to trading pullbacks.
No, of course, there are various scalping tactics in a channel or a narrow range, but as practice shows, trading in the direction of the main trend and searching for entry points in its direction turns out to be the most effective.
Unlike trading in a narrow range or flat market, all trading is conducted with short stop orders. Due to the eternal rule "The trend is your friend," you will very rarely encounter an entry against the market, and the profit size will often exceed the risk.
Entries on Resumes
For scalping strategies that involve trading pullbacks, the main task is identifying the trend. There are many options for determining trends, ranging from graphical analysis to the use of technical indicators.
When using this strategy, no matter how you define the trend, the key is its clear outline. For example, you can use a trend line. Incidentally, trend lines also need to be drawn correctly, so I recommend familiarizing yourself with the Sparandeo method.
 The strategy is based on a simple principle: if a pullback forms in a downtrend, most traders will trade for a rebound. This also applies to uptrends.
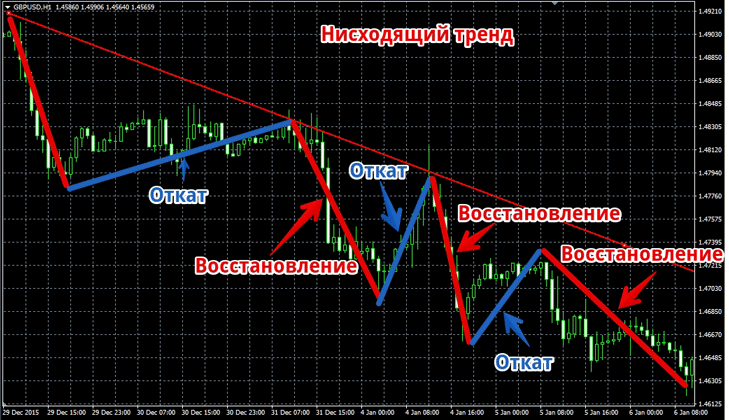
It's worth noting that this pattern is very easy to see, and new movements lead to breakouts of important levels and the resumption of new highs and lows. For an example, I recommend looking at the following image of market behavior:
Rules for entering a position
The figure above clearly shows typical price behavior after a pullback. According to the strategy's rules, we're primarily interested in the recovery section. While historically everything looks quite clear and understandable, in practice it's much more complicated.
The only difficulty in trading is finding a timely entry point. To find it, you need to base your trading on support or resistance, as well as important Fibonacci retracements.
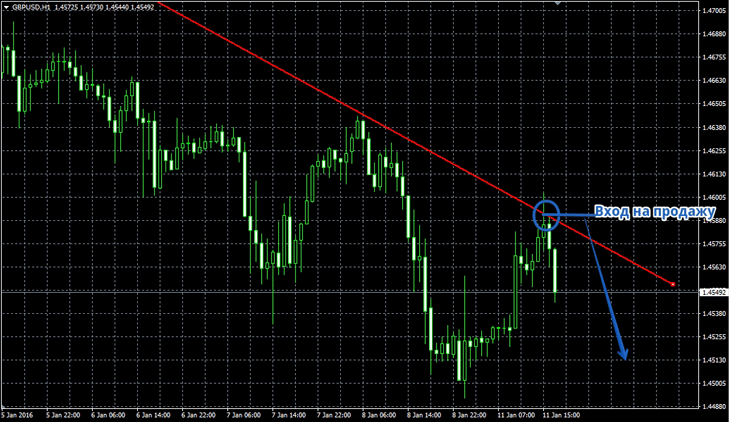
Rules for entering a sale:
1) There is a clearly formed downward trend in the market.
2) The price touched a significant resistance level during the pullback. If a trend line is used to define the trend, it should be considered a resistance level, and the position should be entered in the direction of the trend.
Also, the price touching one of the Fibonacci levels can serve as a point for entering the market.
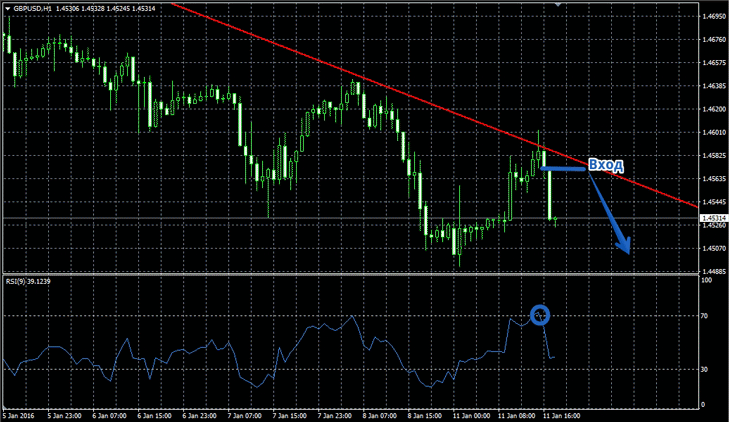
Example of a sell signal:
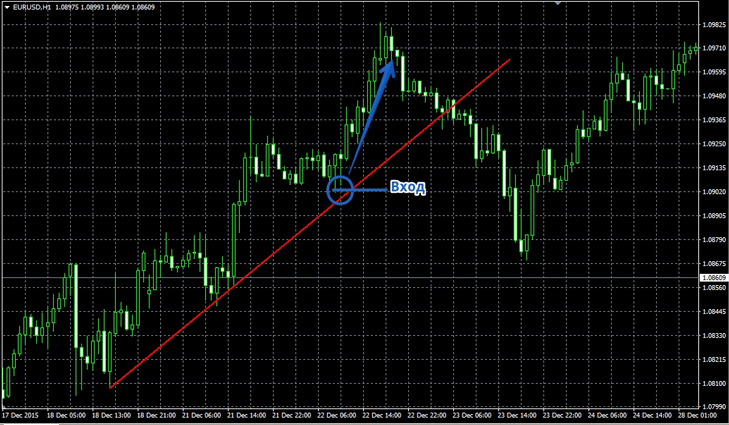
Rules for entering a purchase:
1) There is a clearly formed upward trend in the market.
2) The price touched an important support level during the pullback. If a trend line is used to define the trend, it should be considered a resistance level, and the position should be entered in the direction of the trend.
Also, the price touching one of the Fibonacci levels can serve as a point for entering the market.
Example of a buy signal:
Application of oscillators
To simplify the search for entry points for this strategy, you can successfully use a number of oscillators, such as CCI, RSI, and MACD. For example, if you use the RSI indicator, to enter a sell position, the price must be near the resistance level, and the RSI must exit the overbought zone.
Stop order and profit when scalping on pullbacks.
Any scalping strategy is characterized by a very small stop order relative to the potential profit on the trade. When trading retracements, the stop order should be set a couple of pips above the support or resistance line, and in our case, 5-10 pips above the trend line.
Because the recovery phase is characterized by strong price movements, the profit margin should be no less than the width of the pullback. For an example, see below:
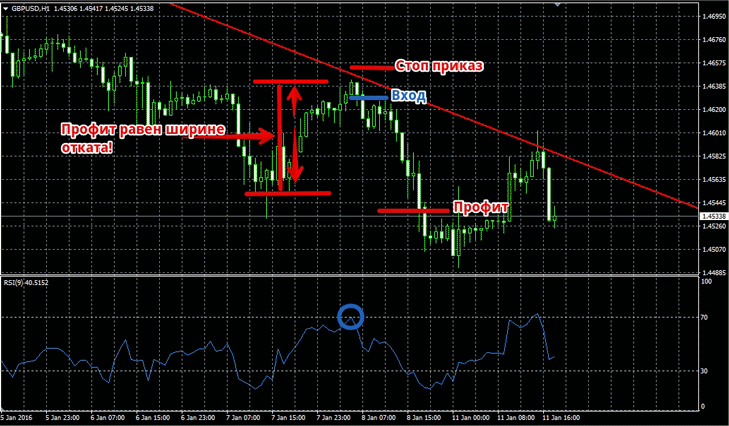 Overall, the strategy relies on fundamental market patterns, so it can be applied to any currency pair or timeframe. The difference in application across different timeframes is that on five-minute charts, the stop loss size will be much smaller than on M30 or H1, as shown in the example.

