Rollback strategy
Any strong trend movement sooner or later runs into some kind of support and  resistance levels, as a result of which we can see a short-term price reversal.
In trader parlance, this situation is called a "Pullback," since the price rolls back a certain distance from the global trend, and then begins to move back in the direction of the global trend.
There is a common belief that rollbacks are deliberately created by large players in order to disrupt as many stop orders as possible from naive players.
Perhaps no one knows the truth, but if you think about it logically, pullbacks are most often formed due to positive news against the backdrop of a significant deterioration in the economy as a whole, or vice versa. It is not for nothing that sooner or later the next pullback develops into a new trend.
Many people suffer losses during pullbacks, but if you're confident in the underlying trend, a pullback is the most profitable entry point in the direction of the underlying trend. To find such entry points, I suggest using an indicator-based pullback trading strategy.
Since the strategy is universal, you can apply it to any currency pair and time frame. However, observations have shown that the strategy is more effective on hourly and four-hour charts due to less market noise.
Rollback strategy desktop. Template creation.
The pullback trading strategy consists of five indicators, namely two moving averages with periods of 200 and 50, the Parabolic SAR indicator, MACD(38,120,20), and Stochastic. You can apply them individually to the chart, specifying all the necessary settings, or you can download and install the template at the end of the article. Once launched, all indicators will appear automatically.
To install the template, go to your terminal's data directory, which you can find in the File tab of a running MT4. Place our template in the folder named "Template" and click "Update" in the "Navigator" panel. After completing these steps, go to your template list and run "Pullback Strategy." You'll end up with a template like this:
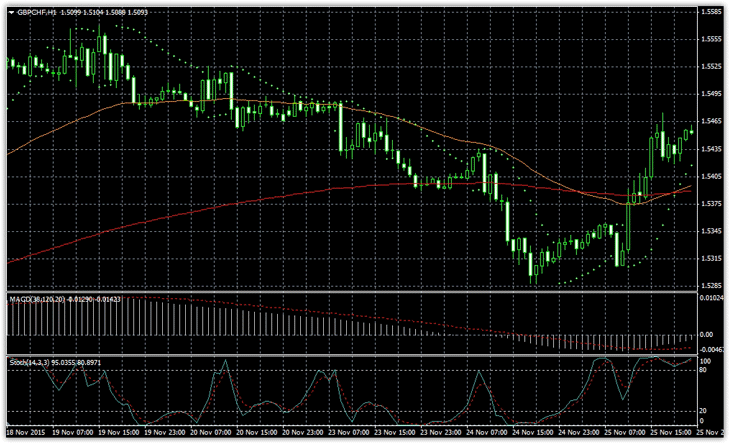
The essence of strategy. The purpose of the elements
Pullback trading is based on a simple pattern of price behavior. However, while it's easy to recognize a pullback even without indicators, many traders may have trouble finding entry points and filtering out the trend.
The strategy uses two indicators to identify the main trend direction: the MACD and a 200-period moving average. For example, trading is only conducted short if the MACD indicator chart is below the zero line and the price is below the 200-period moving average.
To identify an uptrend, the same indicators are used, but the MACD histogram must be above the 0 line, and the price above the 200-period moving average. The touch of the 50-period moving average is used as the point that signals that the pullback has reached its peak, and the entry point is the Stochastic indicator crossing the 50 level.
By understanding the purpose of each element of the strategy, you can refine and adjust the strategy according to your preferences.
Signals
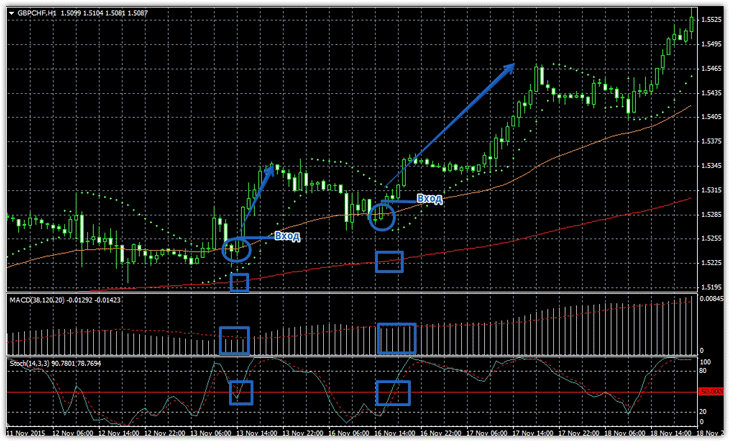
For a buy signal to appear, the following conditions must appear on your chart:
1) The price chart is above the moving average with a period of 200 (red line).
2) The MACD indicator is above the zero line.
3) The price crossed or touched the 50-period moving average.
4) The Stochastic indicator crosses level 50 from bottom to top.
A position should only be entered on a closed candle, as the signal may be cancelled if the price continues to move sharply. Example of a buy signal:
For a sell signal to appear, the following conditions must appear on your chart:
1) The price chart is below the moving average with a period of 200 (red line).
2) The MACD indicator is below the zero line.
3) The price crossed or touched the 50-period moving average.
4) The Stochastic indicator crosses the 50 level from top to bottom.
A position should only be entered on a closed candle, as the signal may be cancelled if the price continues to move sharply. Example of a sell signal:

Stop orders and trailing positions
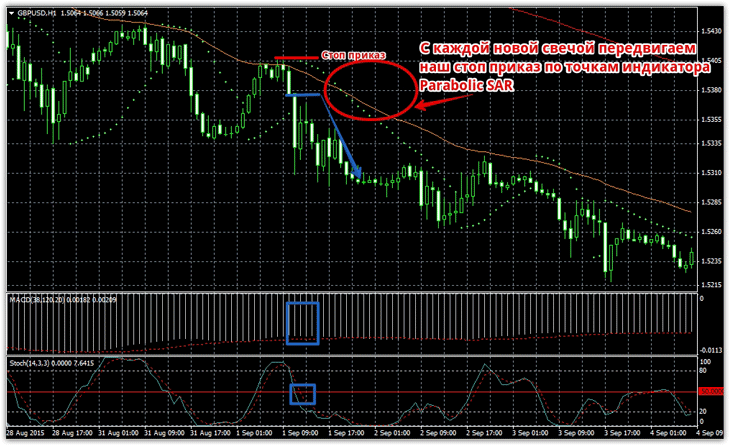
According to the strategy rules, a stop order should be placed at a local high for sells and at a local low for buys. If you have difficulty finding these levels, place your stop order at the parabolic point.
The strategy doesn't use a take-profit, so instead, you should move your stop loss based on the Parabolic SAR, which will allow you to squeeze out maximum profit from the market rather than being limited to a predetermined profit target. See the example image below:
A few words about capitalmanagement
When trading on higher timeframes, such as H1 and H4, you may have 3-5 trades per week, but these have significant potential. In terms of risk, you should calculate your lot size so that if a stop order is triggered, your loss will not exceed two percent of your total capital.
Finally, before choosing a currency pair, look at its historical price behavior. If there's no need to make adjustments during the moving average period, you can safely begin trading.
Download the template for the pullback strategy.

