Tactica Adversa.
Tactica Adversa is a relatively new direction in the field of graphical analysis, and this approach has been on its way since the early 2000s.
If you start searching Google and try to find useful information about strategy, you will probably come across a number of abstruse words about esotericism and sacred points, as well as all sorts of expressions in this spirit.
It's worth noting that the author's explanations of the strategy are so abstruse and mystical that after reading a couple of paragraphs, any sane person will close the book.
Perhaps this approach has become a thing of the past, and traders have lost interest in it due to unclear and sometimes illogical explanations, while a clear algorithm of actions for a trader is out of the question.
However, despite the author's verbal exaggeration of the technique, it is based on just two simple patterns that you may have also observed repeatedly on the chart.
The tactic itself and its patterns can be applied to any asset type and currency pair. It's also worth noting that the Adversa tactic is an indicator-free strategy, requiring only a candlestick chart and trend lines.
Tactica Adversa can be used on any time frame.
Patterns in Tactics Adversa. Construction
The Adversa Tactic is based on two patterns called "Expansion" and "Attraction." To construct them, you'll need two trend lines and four extremes depending on the trend direction.It is worth noting that extremes (local minima and maxima) are determined visually, but if you have difficulty in determining them, you can use this wonderful indicator like Zig-Zag.
Expansion Pattern
The Expansion pattern is built on the basis of four points, and the construction occurs as the market situation develops.
There are two options for constructing the model: one for a bullish market and one for a bearish market. So, let's look at the general principles of construction and some application options.
For an uptrend, we find two consecutively rising local lows and draw an ascending trendline through them. A high should be located between the two lows.
Thus, our pattern will consist of points 1-2-3. Then we wait for a new maximum to form, which should be higher than point 3 and form a new extreme point 4. We draw a trend line through points 2 and 4 (connecting the two local maximums).
Thus, we obtain two expanding trend lines. After the price touches the lower trend line and forms a third low (point 5), a buy position is opened with a target of the previously formed local high at point 4. A breakout of this opens the way to the opposite trend line (point 6). Example:

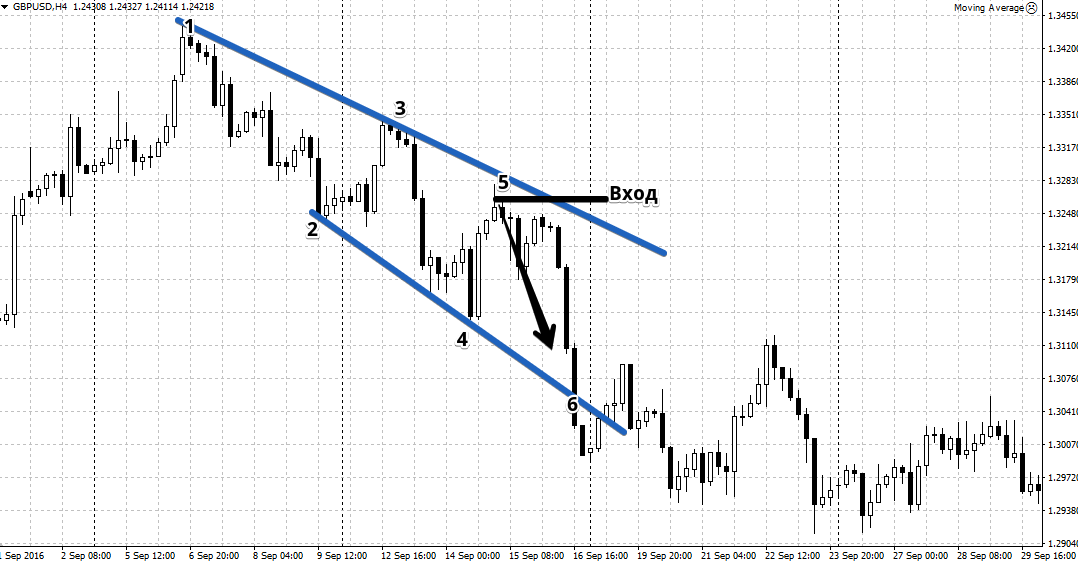
If the market is down, we draw a trend line along two successively decreasing highs, with a local low between them, which creates a three-point 1-2-3 pattern.
Then wait for the price to form a new low (point 4). Draw a trend line through points 2 and 4, which should create the appearance of two diverging trend lines (an expanding channel).
After the price bounces off point 4 and forms a third local high (point 5), open a sell position with a target of point 4, and then the opposite trend line (point 6). Example:
The Attraction Pattern
If the pattern we looked at above allows you to find clear entry points into the market, then thanks to the “Attraction” pattern you can see the probable end point of the trend.
The Attraction pattern is quite rare, but it appears in both bull and bear markets.
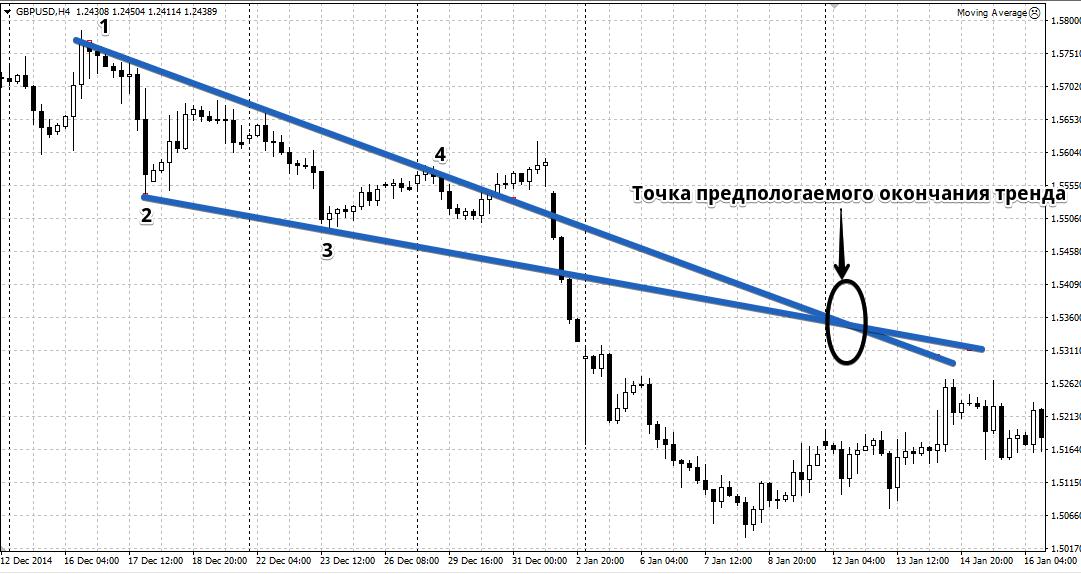
To construct the "Attraction" pattern for a bearish market, you'll need at least four points. First, draw a trendline through two declining extremes. A strong low should form between the two local descending highs, creating a 1-2-3 pattern.
Then we wait for a new strong local minimum to emerge, which will occur as a result of a rebound from the upper trend line. Connect the two descending lows with a trend line.
Ultimately, you will get a kind of triangle, and the intersection point of the trend lines is the very “Sacred Point according to Adverse”, near which you should expect the end of the trend. Example:
To construct the "Attraction" pattern in a bullish market, the conditions are completely opposite, namely, the first line is drawn through two local minimums, while the second is drawn through two local maximums.
In conclusion, it is worth noting that the Adversa tactic is designed primarily for experienced traders, given that you must have experience working with trend lines, channels, and also with support and resistance lines.
The disadvantage of this tactic is the subjectivity of its application, namely, each trader, depending on their experience, may find and define extremes on the chart differently.

