Trend lines in trading and the secrets of their construction
Trading on the stock exchange involves using market analysis tools, which alone can improve trading efficiency.

It is not at all necessary to use complex technical analysis indicators; there are many simple tools that can help in your work.
These tools also include trend lines, which take a couple of minutes to plot, and the resulting results will help you understand where the price is heading.
This is a simple way to determine the market direction, find entry points and notice a change in trend in time, an additional reference point for stop loss and take profit.
A trendline is a straight line on a chart that shows the general direction of price movement. It typically connects two or more price highs or two or more price lows.
If the line is directed downwards, this is a downtrend and the price is falling.
During an upward movement, the line is drawn along the price lows, and during a downward movement, along the price highs. This allows you to see the market structure and understand where the key support and resistance.
Downtrend:
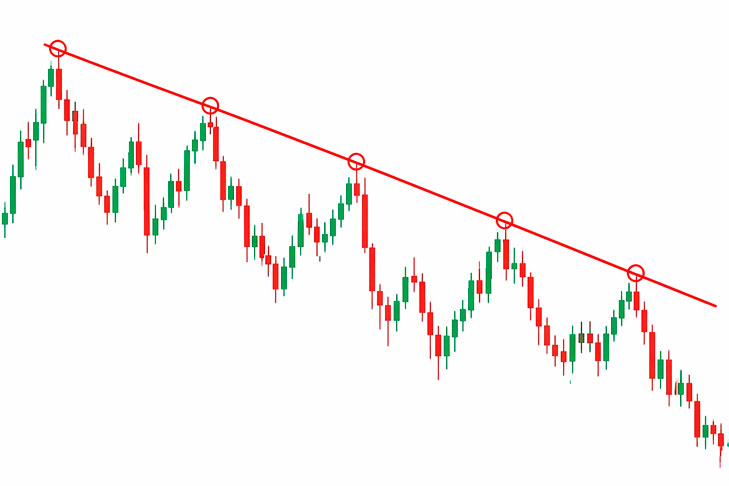
It's important to understand that prices don't move in a straight line, but in waves. It's these waves that are used to construct trend lines.
How to draw trend lines correctly, secrets of drawing
For trend lines to really work in trading, you need to follow a few simple rules.
- The line must have at least two points of contact, but three is better - then it is considered more reliable.
- There is no need to adjust the line to the price - if it “breaks”, it means the trend is already changing.
- A breakout does not always mean a change in trend; breakouts are often false
- Lines are built on the shadows of candles, not on the candle itself
- The larger the timeframe (H1, H4, D1), the stronger the signal and the more reliable the line.
Also, don't overload the chart - one or two lines are usually enough to understand the situation.
An example of using a trend line
An uptrend is forming on the chart. You draw a line along the lows, and the price bounces off it several times.
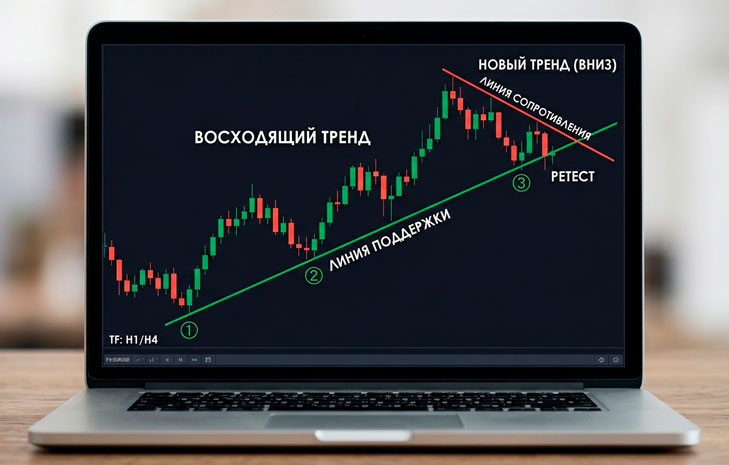
This means that the line acts as support and is seen by other market participants.
When the price approaches the line again, this is a potential entry point for a buy.
If the price breaks through the line and settles below, this is a signal of a possible change in trend or the beginning of a correction.
A simple trend line trading strategy
Trend lines can be used in trading even without additional indicators.
Open a chart on the H1 or H4 timeframe and draw a trend line based on the current price movement. Then wait for the price to approach the line again.
Entry into buying occurs when there is an upward rebound from the line in an uptrend.
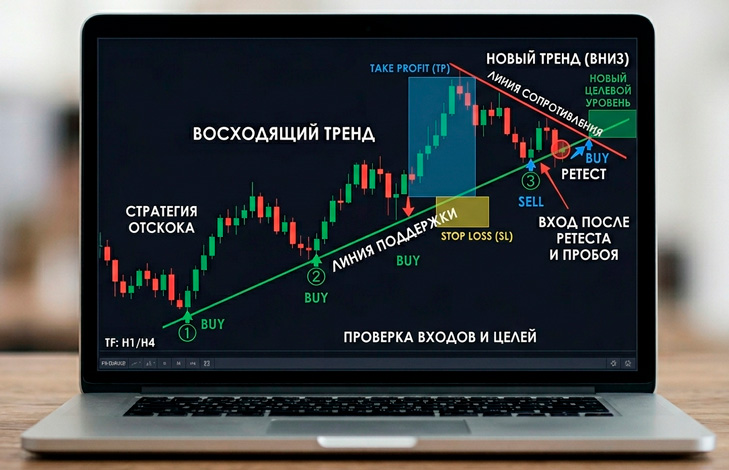
Enter a sell trade when there is a rebound down in a downtrend.
Stop loss is placed behind the trend line, with a small margin.
Take profit – at the nearest level or with a risk/reward ratio of at least 1:2.
To increase accuracy, you can wait for confirmation - for example, a reversal candle or a slowdown in movement.
Trend lines in trading work for a simple reason: they are visible to virtually all market participants.
Major players, algorithms, and individual traders all target the same levels. Therefore, prices often react to these lines with rebounds or breakouts. This isn't random, but a reflection of market behavior.
Trend lines in trading are a simple and effective tool that allows you to quickly determine market direction, find entry points, and manage risks when opening trades.

