MACD Histogram
The MACD histogram is the difference between the MACD line and its signal line: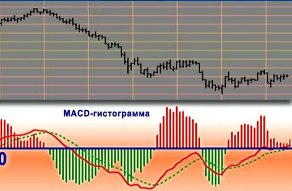
• When the MACD line exceeds the signal line, the histogram is shown with a positive value, exceeding zero;
• When the MACD line is less than the signal line, the histogram crosses zero.
The MACD technical indicator belongs to the class of technical analysis indicators, that is, it is an oscillator and is used to calculate the trend. The MACD histogram is constructed using exponential moving averages (EMA): fast (up to 12) and slow (up to 29). It is depicted on the chart in the form of bars.
Simple Moving Average
A simple moving average is a simple and popular technical analysis indicator. It is one of the indicators that follows  trend movements, helping to identify the beginning of a new direction and signaling its completion. Its slope is used to calculate the strength of an existing trend.
This indicator is used as a basis in many technical indicators. A trend line constructed from its points is also called a simple moving average.
A simple moving average is a simple arithmetic average of the price value over a specified period.
It's calculated using the following formula: prices are summed across several time frames for the desired period, and the resulting sum is divided by the number of time frames.
Basic reversal patterns.
Reversal patterns are a fundamental element of graphical analysis. They signal an imminent trend reversal, allowing trades opened in line with the current trend to be closed promptly.
The search for reversal patterns should be preceded by an understanding that the previous trend not only existed, but was also clearly defined. The first signal that a pattern has been identified correctly is a breakout of important trend lines.
Relative Strength Index (RSI).
The Relative Strength Index is one of the most popular indicators that works well in the trading market.
This name was given to the term by its developer, Welles Wilder. The formula for determining the indicator consists of two values:
• U (n) is the sum of positive price changes at the end of n intervals,
• D (n) is the sum of negative price changes for those time intervals in which sales ended at a reduced cost compared to the previous period.
Thus, the relative strength index (RSI) shows the dynamics of price changes in the direction of their movement, converts the cost into a percentage, showing places of purchase (up to 30%) and sale (over 70%).
Pennants and flags in Forex.
The use of graphical analysis often causes controversy among traders, but most are still inclined to believe that it also contains figures that predict trend behavior with relatively high accuracy.
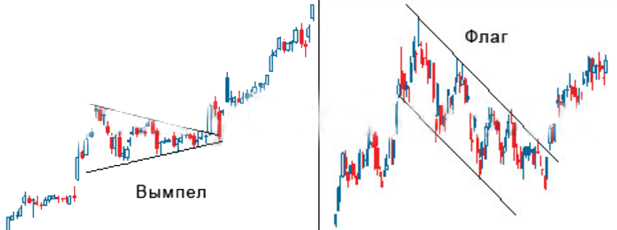
The pennant and flag fall into this category of figures; the appearance of such figures on a currency pair chart allows you to prepare for a successful trade and take measures to insure an existing position.
Gann Grid
The Gann grid consists of trends arranged at a 45-degree angle. According to Gann's concept, the 45-degree line represents a long-term trend line. As long as the price remains above the rising line, the market is in a bullish trend.
When prices are below the falling line, a bearish trend begins. If the Gann lines intersect, this indicates a reversal of the overall trend.
Gann line
A Gann line is a line drawn at a 45° angle. The concept was developed by William D. Gann, a successful broker who 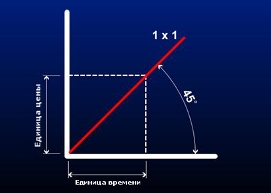 traded stocks and various commodities.
He applied mathematical and geometric rules to his analysis. The trader's work is based on the relationship between time and price. In his research, he placed great emphasis on the highest and lowest points.
Gann lines are trend lines drawn at an angle from the highest or lowest point. The angles are calculated based on price and period. When constructing a 45° angle on an uptrend, the lowest point is determined and a line drawn upward. In a downtrend, a line extends from the highest point to the right and downward. The Gann line provides an equal balance between time and price.
Main parameters of the trend.
Many traders claim that simply knowing and being able to identify the basic parameters of a trend is sufficient for successful forex trading.
However, experience shows that not all beginners realize that, in addition to trend direction, there are a host of other, equally important indicators.
The most important of these include minimum and maximum prices, the magnitude and frequency of corrections, support and resistance levels, strength, volatility, and, of course, the direction of movement.
In most cases, identifying these indicators is sufficient for a successful trade; however, it should be noted that there are some unique aspects to this process when trading forex.
Weighted Moving Average
The main flaw of the simple moving average is that every value is given equal weight in the calculation, although in fact the most valuable is the most recent market price data.
The WMA indicator does not have this flaw; it is a standard transformation of a simple moving average with selected quotes so that the latter indicator always has more weight.
Accordingly, the Weighted Moving Average is an average indicator, in the determination of which, at the initial stage, the determination of all indicators is equal to a certain member of the calculation series.
Trading without indicators.
There's a category of Forex traders who, for one reason or another, don't want to use technical analysis indicators. Some can't  configure them, while others simply don't trust other people's scripts.
For these traders, indicator-free trading is just the ticket. It's just as effective as trading with technical tools, and in some cases, even superior in performance.
Indicator-free trading involves manually opening trades based on data obtained through technical and fundamental analysis.
While this may seem like a daunting task, it actually simplifies the entire trading process. Successful trading requires only logical thinking and access to information.
How to read technical analysis charts.
The chart in a trader's terminal is the primary focus of technical analysis. Even without using specialized indicators, you can  learn quite a lot simply by reading a currency pair's chart.
Most of the indicators needed for technical analysis are readily apparent, and the chart provides insight not only into the current market situation but also into what was happening with a given currency pair a month or a year ago.
What information does a currency pair chart contain?
Andrews' Pitchfork
Andrew's Pitchfork is a popular technical analysis indicator. It was developed by Alan Andrews. 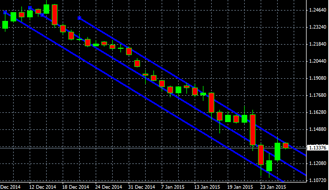
In everyday work, Andrew's Pitchfork helps traders identify periods of trend continuation and resistance in the forex market.
It serves as a tool for dividing the main channel into two equally spaced ones, allowing for a more complete trend analysis.
During an upward trend, the Andrew's Pitchfork chart uses three points:
• A significant increase in the trend;
• A significant decrease in the trend;
• A common point, which serves as the initial stage of the trend.
The most effective forex level indicators in practice
Price levels play a decisive role in choosing entry points into the market; they serve as the main guidelines for opening trades or as signals for 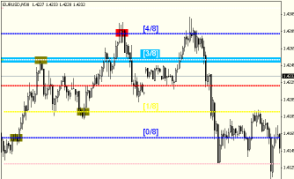 closing them.
If you wish, you can manually identify the most important ones, but it is easier to use technical assistants.
Forex level indicators are scripts that, based on historical price action and current quotes, identify the most significant levels on a chart.
There are many such technical tools, and in this article, we'll explore the most effective ones.
Types of Forex charts.
The bulk of technical analysis is based on Forex charts, which provide 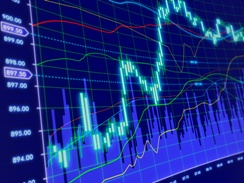 insight into price behavior.
Several chart types are available in a trader's trading terminal, and choosing the most appropriate one depends solely on personal preference and the objectives.
Forex chart types in MetaTrader 4 include line charts, bar charts, and Japanese candlesticks. Additionally, there are some general parameters that should be considered during analysis.
These parameters include:
Elliott Waves.
Crowd behavior is subject to certain laws and changes according to certain rules. Any freely  traded asset is inextricably linked to the will of a large number of people, a kind of crowd. It would be logical to find patterns here as well and try to develop methods for successful trading.
This is precisely what accountant Ralph Nelson Elliott did at the beginning of the last century. Studying the bizarre movements of market prices, he concluded that the market, as a product of crowd psychology, has a unique, constantly repeating wave structure. Having established that the wave relationships in this structure obey Fibonacci proportions, Elliott created a subtle and timeless tool for analyzing commodity and financial markets.
What is the essence of this work? Elliott's basic patterns consist of impulse and corrective waves. An impulse wave has five smaller waves and moves in the same direction as the higher-order trend. A corrective wave (forex pullback) contains three subwaves and is directed against the trend. By connecting with each other, these structures form larger formations of the same figures, which, by combining, create even larger specimens... And this process is endless.
Stages of technical analysis of the Forex market.
Technical analysis of the Forex market involves studying the dynamics of exchange rate movements.  This is why price charts for previous trading periods (timeframes) are used as its primary tool. Charts with timeframes ranging from five minutes to several years are used for analysis.
It's worth noting that charts with longer periods exhibit significantly less "market noise," or false movements. Therefore, they clearly show the prevailing trend lines, key chart patterns, and support/resistance levels. This allows for a relatively objective forecast of the most likely direction of exchange rate movements.
Experts in global Forex trading recommend conducting technical analysis every week before the start of the next five-day trading period. They divide this analysis into three stages.
Page 3 of 4

