Top 10 Trading Indicators for the MetaTrader Platform
Modern trading on Forex or any other market is almost impossible to imagine without the use of technical analysis indicators.
Most of the created tools are intended for installation on the MetaTrader trading platform, and this is not surprising, since this program is the most popular today.
At the moment, MetaTrader 5 has 38 technical analysis indicators and oscillators installed by default.
Each of them analyzes trends in its own way and helps a trader in stock trading, but among the presented tools there are also leaders, so to speak, the top 10 best.
At the moment, we can highlight the top 10 indicators that can be found in MT5
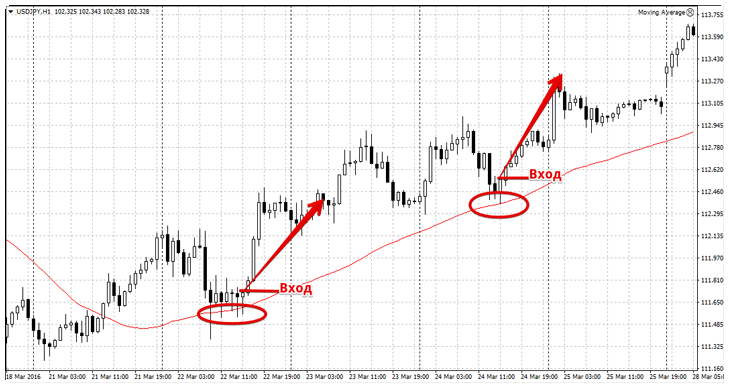
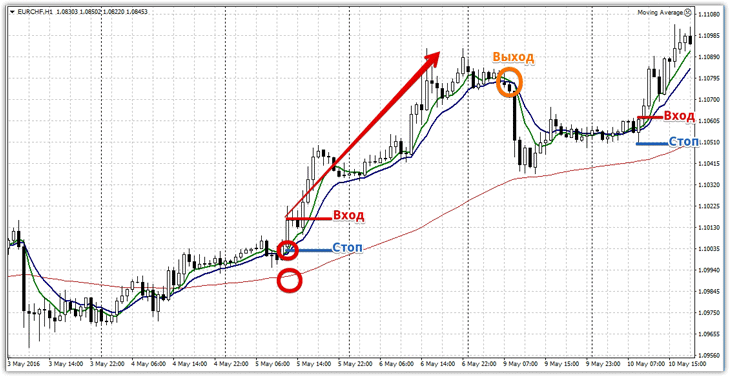
A simple moving average (SMA) is an indicator that calculates the average price value over a specified period of time. SMAs can be used to identify trends, support and resistance, and to forecast future prices.
More information about the indicator - https://time-forex.com/indikators/indikator-sma
An exponential moving average (EMA) is an indicator that also calculates an average price value, but with a greater weighting function for more recent prices. An EMA is more sensitive to price changes than an SMA and can be used to identify smaller trends.
Strategy for this indicator - https://time-forex.com/strategy/st-ema
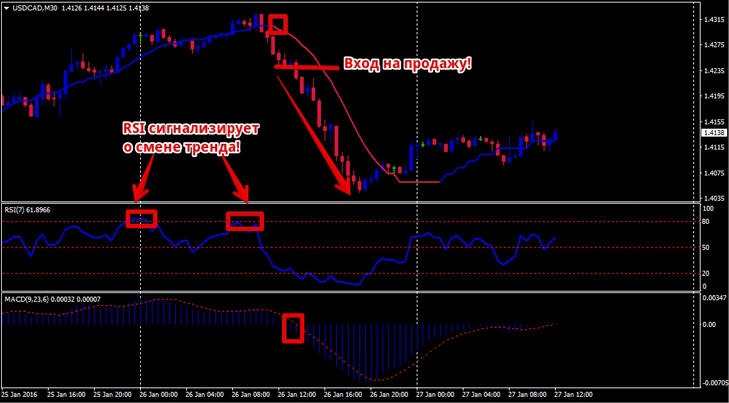
The Relative Strength Index (RSI) is an oscillator that measures the rate of price change. RSI can be used to determine whether a market is overbought or oversold, as well as to forecast future prices.
RSI strategy example - https://time-forex.com/strategy/st-rsi
The Moving Average Convergence Divergence (MACD) indicator is an oscillator that measures the difference between two moving averages. MACD can be used to identify trends, support and resistance, and to forecast future prices.
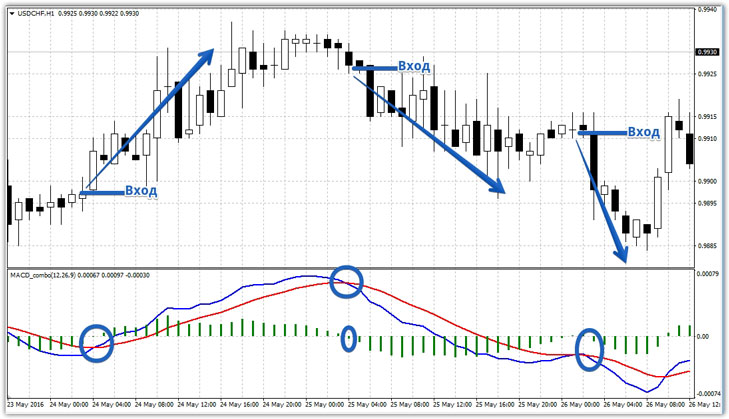
Improved indicator - https://time-forex.com/indikators/macd-combo
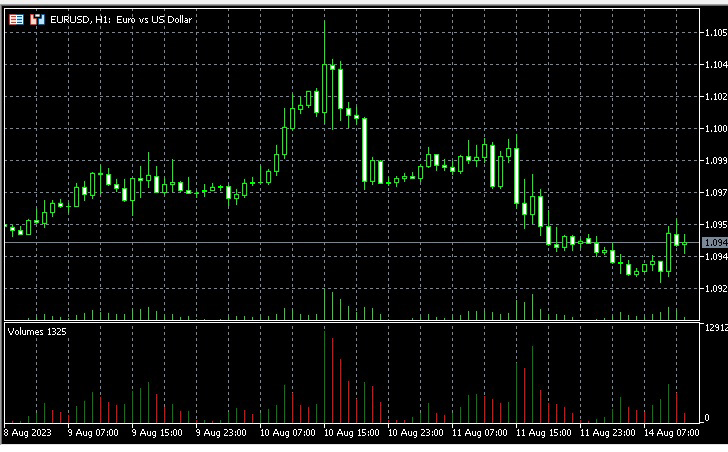
The Volume indicator measures trading volume. Volume can be used to confirm trends and predict future prices.
The Bollinger Bands (BB) indicator measures the deviation of a price from its average price. BB can be used to identify overbought and oversold market conditions, as well as to forecast future prices.
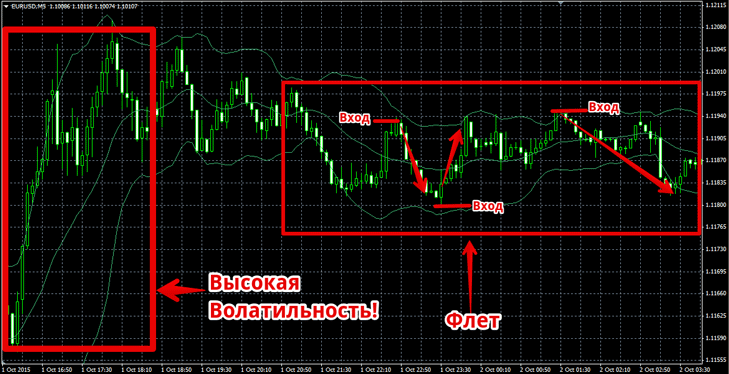
Bollinger Bands Strategy - https://time-forex.com/strategy/st-bollindgera
The Directional Movement Indicator (ADX) is an indicator that measures the strength of a trend. The ADX can be used to identify long-term and short-term trends, as well as to forecast future prices.
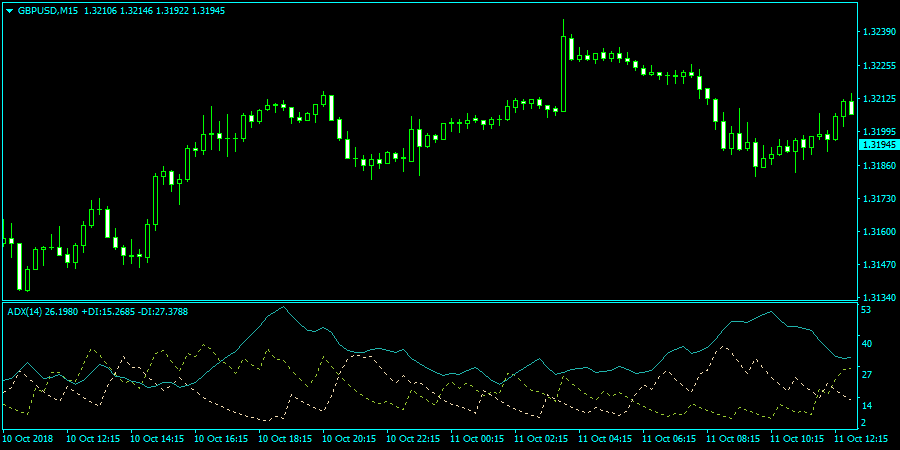
How the ADX Script Works - https://time-forex.com/indikators/average-directional-movement-index
The stochastic indicator is an oscillator that measures the position of a price relative to a specified price range. Stochastic can be used to determine whether a market is overbought or oversold, as well as to forecast future prices.
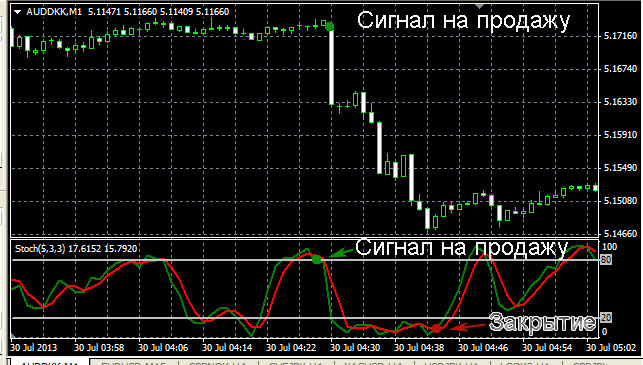
A simple strategy based on Stochastic - https://time-forex.com/strategy/strategiy-stohastik
I would put this tool in first place in the top 10 indicators of the trading platform, as I am almost always satisfied with the results of its use.
The Williams %R indicator is an oscillator that measures price position relative to a specific support level. Williams %R can be used to determine overbought and oversold market conditions and to forecast future prices.
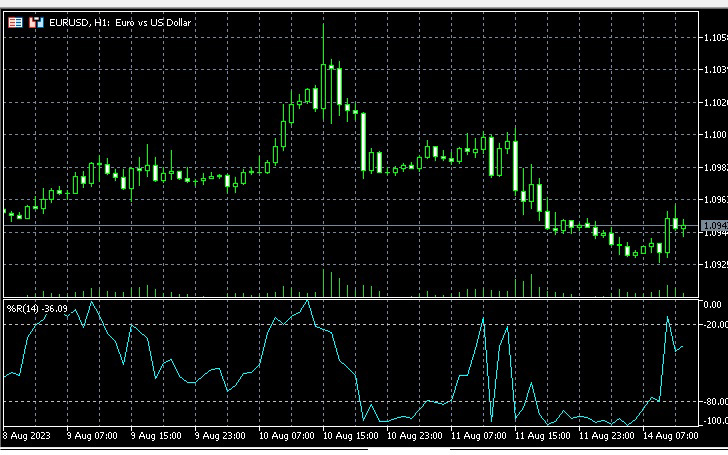
Advanced version - https://time-forex.com/indikators/multi-williams
Ichimoku Kinko Hyo (一目均衡表, Japanese: "One Glance, Overall Balance") is a Japanese technical indicator that combines several different indicators, such as moving averages, trend lines, and the Ichimoku cloud. It was developed by Goichi Hosoda in the 1960s.
![]()
The Ichimoku indicator can be used to identify trends, support and resistance, and forecast future prices. Learn more about the indicator at https://time-forex.com/indikators/in-ichimoku
There are other, equally interesting indicators that didn't make the top 10, but to use them, you first need to download the required tool and then install it on your trading platform.
Popular indicators ranking according to our website - https://time-forex.com/info/reyting-indik
But no matter how effective the listed technical analysis indicators may seem, the greatest profitability in trading can be achieved if fundamental analysis data is also taken into account when opening trades.

