Simple Moving Average
The simple moving average is a simple and popular technical analysis indicator. It is one of the indicators that repeats the movements of a trend, it helps in determining the beginning of a new direction and reports its completion, according to its inclined angle the strength of the existing trend is calculated.
This indicator is used as a basis in many technical indicators. Also called a simple moving average is a trend line constructed based on its points.
Simple Moving Average is a simple arithmetic average of the price value of a certain period.
It is calculated using the following formula: the prices for several time frames are summed up for the period of time you need and the resulting amount is divided by the number of time frames.
Basic reversal patterns.
Reversal patterns are a basic element of graphical analysis; they give signals about an imminent trend change, which makes it possible to close transactions that were opened according to the current trend in a timely manner.
The search for reversal patterns should be preceded by an understanding that the previous trend not only existed, but was also clearly expressed. The first signal that says that the pattern has been detected correctly is a breakthrough of important trend lines.
Relative Strength Index (RSI).
Relative Strength Index is one of the most popular indicators that works well in the trading market.
This name was given to the term by its developer Wells Wilder. The formula for determining the indicator consists of two quantities:
• U (n) – the sum of positive price changes at the end of n periods,
• D (n) – the sum of negative price changes in those time periods in which sales ended with a reduced price compared to the previous period.
Thus, the relative strength index (RSI) shows the dynamics of price changes in the direction of their movement, transforms the cost into a percentage, showing the places of purchase (up to 30%) and sales (over 70%).
Pennants and flags on Forex.
The use of graphical analysis often causes controversy among traders, but the majority is still inclined to believe that there are figures in it that predict trend behavior with relatively high accuracy.
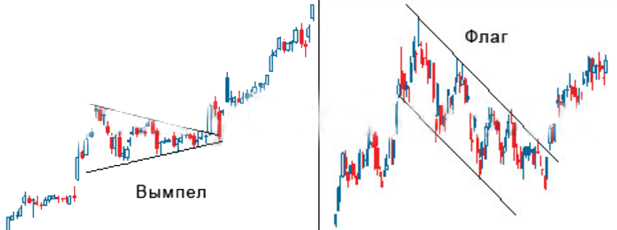
The category of such figures includes a pennant and a flag; the appearance of such figures on the chart of a currency pair allows you to prepare for opening a successful transaction and take measures to insure an existing position.
Gann Grid
The Gann grid consists of trends arranged at an angle of 45 degrees. Following Gann's concept, the 45 degree line is a long-term trend line. As long as the price is above the rising line, the market is in a bullish trend.
When prices are below the falling line, the bearish trend stage begins. If the Gann lines intersect, this indicates a reversal of the general trend.
Gann line
The Gann line is a line drawn at an angle of 45°.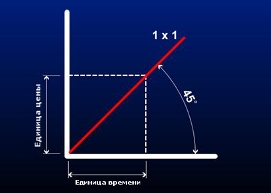 The author of this concept is William D. Gann, he was a successful broker and was involved in the sale of stocks and various commodities.
In his work, he used mathematical and geometric rules for analysis.
A trader's work is based on the relationship between time and price. In his research, he attached great importance to the largest and smallest points. Gann line is a trend line that is drawn from the maximum segment or minimum at an angle. Angles are calculated based on cost and period. When constructing an angle of 45° on an increasing graph, the minimum point is determined and a line is drawn upward. In a downward trend, from the highest point there is a line to the right and down. The Gann line provides for an equal correspondence between time and cost.
Basic trend parameters.
According to many traders, for successful Forex trading it is enough to simply know and be able to determine the basic parameters of a trend.
As practice shows, not all beginners realize that in addition to the direction of the trend, there are a lot of other, no less important indicators.
The main ones are the minimum and maximum price, the magnitude and frequency of correction, support and resistance levels, strength, volatility and of course the direction of movement.
In most cases, for a successful transaction it is enough to determine the listed indicators, although it should be noted that when trading Forex there are some features in this process.
Weighted Moving Average
The main flaw of the simple moving average is that each value is given equal weight in the calculation, when in fact the most valuable data is the latest market price.
The WMA indicator does not have such a flaw; it is a standard transformation of a simple moving average with selected quotes so that the latter indicator always has more weight.
Accordingly, a weighted moving average (Weighted Moving Average) is an average indicator, when determined at the initial stage, the definition of all indicators is equal to a certain member of the computational series.
Trading without indicators.
In Forex, there is a category of traders who, for one reason or another, do not want to use technical analysis indicators; some cannot cope with setting them up; others simply do not trust other people’s scripts.
For such players, there is trading without indicators, which is in no way inferior to trading using technical tools, and in some cases even surpasses it in terms of effectiveness.
Trading without indicators is the opening of transactions based on data obtained as a result of technical and fundamental analysis, carried out manually.
For many, this may seem like a daunting task, but in fact it simplifies the entire trading process; all you need is logical thinking and access to information to succeed in trading.
How to read technical analysis charts.
The chart in the trader’s terminal is the main object that technical analysis studies; even without using special indicators, you can learn quite a lot simply by reading the chart of a currency pair.
Most of the indicators necessary for technical analysis are visible to the naked eye, and the chart makes it possible to get an idea not only of the current market situation, but also to find out what happened with a given currency pair a month or a year ago.
What information does a currency pair chart contain?
Pitchfork Andrews (Andrew's Pitchfork)
Andrews Pitchfork is one of the popular technical analysis indicators.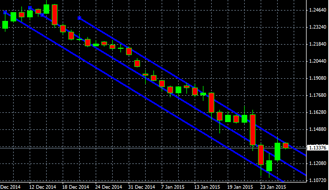
It was designed by Alan Andrews. In everyday work, Andrews Pitchforks are an assistant for a trader in determining segments of continuation of trends and counteraction in the foreign exchange market.
It serves as a tool for dividing the main channel into two equally spaced ones.
This allows you to more fully analyze the trend. During an uptrend, the Andrews Pitchfork chart design uses 3 points:
• A significant increase in the trend;
• Significant decrease in trend;
• A common point that serves as the starting point of a trend.
The most effective in practice Forex level indicators
Price levels play a decisive role when choosing entry points into the market; they serve as the main guidelines for opening transactions or are signals for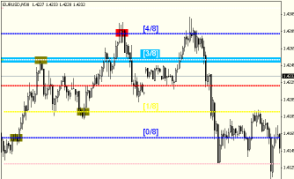 closing them.
If you wish, you can manually determine the most important of them, but it is easier to use technical assistants.
Forex level indicators are scripts that, based on the history of price behavior and current quotes, find the most significant of them on the chart.
There are quite a lot of similar technical tools, and in this article we will get acquainted with the most effective of them.
Types of Forex charts.
The main part of technical analysis is based on Forex charts; it is their analysis that allows us to obtain data on price behavior.
There are several chart options that are available in the trader’s trading terminal; the choice of the most suitable one depends only on personal preferences and the tasks that are set.
Types of Forex charts in MetaTrader 4 – line, bar, Japanese candles.
In addition, there are some general parameters that should be taken into account when conducting the analysis. These parameters are:
Elliott waves.
The behavior of the crowd is subject to certain laws and changes according to certain rules. Any freely traded assets are inextricably linked with the will of a large number of people, a kind of same crowd.
It would be logical to find your own patterns here and try to develop methods of successful trading. This is what accountant Ralph Nelson Elliott did at the beginning of the last century.
Studying the bizarre movements of market quotes, he came to the conclusion that the market, as a product of crowd psychology, has a unique, constantly repeating wave structure. And, having established that the ratios of the waves in this structure obey the Fibonacci proportions, Elliott produced a subtle and immortal tool for analyzing commodity and financial markets. What is the essence of this work? The main Elliott patterns consist of impulse and corrective waves. An impulse wave has five smaller waves and moves in the same direction as the higher order trend. The correction wave ( Forex pullback ) contains three subwaves and is directed against the trend. Connecting with each other, these structures form larger formations of the same figures, which, when combined, create even larger specimens... And this process is endless.
Stages of technical analysis of the Forex market.
Technical analysis of the Forex market refers to the study of the dynamics of exchange rate movements. That is why quote charts for previous trading periods (time frames) are used as its main tool.
For analysis, graphs with time periods from five minutes to several years are used. It should be noted that on charts with long periods there is much less “market noise”, that is, false movements.
Therefore, the lines of the prevailing trend, the main graphic figures, as well as support/resistance levels are clearly visible on them. This allows you to make a relatively objective forecast of the most likely direction of movement of currency quotes. Experts in the field of trading on the global Forex market recommend conducting technical analysis every week before the start of the next five-day trading period. At the same time, they divide the process of such analysis into three stages.
Trend reversal reasons and signs.
Trading with the trend has always been a priority area of Forex trading; you just need to open a deal and you can assume that the profit is in your pocket; everything would be exactly like this if it were not for the so-called trend reversal.
It is for this reason that most deposits are drained and the largest drawdowns occur; there can be many reasons for a reversal, but the result of such an event is always the same - losses.
Page 3 of 4

