“Trend all period” indicator.
The name of this indicator speaks for itself: it is designed to simultaneously determine the trend on all periods. 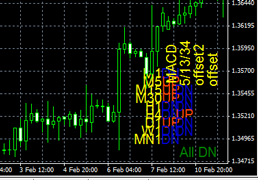
Needless to say, this approach provides a more complete picture of the market situation.
The "Trend for All Periods" indicator is one of the best trend-tracking tools that requires no additional configuration.
Elder indicator.
This indicator is often called "Bulls-Bears", since its main task is to identify a change in trend.
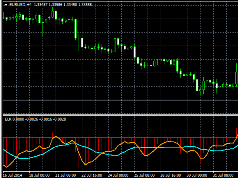
The Elder indicator signals trend changes and evaluates their strength, allowing traders to anticipate market reversals in advance.
It's a fairly advanced tool with simple settings and excellent visual display of the data.
The indicator can be classified as an oscillator, as it attempts to slightly anticipate the market and warn traders of upcoming changes.
Trend forecast indicator.
Xprofuter is one of the most well-known trend forecasting indicators among traders. Although the accuracy of its predictions is rather questionable, 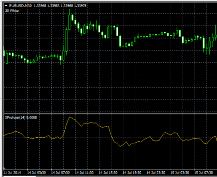 editing the basic settings may improve the situation.
The trend forecast indicator, according to its creators, outperforms the existing trend by 10-12 bars.
It works by creating its own trend line, which is displayed in a separate window, and a second line. Unlike the first, it simply extends the existing trend line on the chart.
Trend trading indicator.
Another attempt to predict the trend's mood, an indicator with a fairly large number of indicators that allow you not only to receive 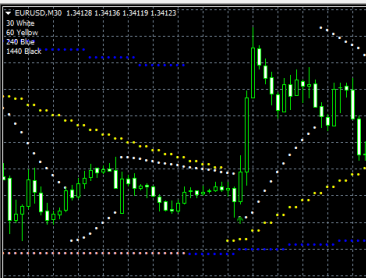 entry signals, but also to set stop orders.
The trend-following indicator alerts traders to trend changes, allowing them to successfully open new trades or close existing ones in a timely manner.
Its operation covers three time frames simultaneously, allowing for more comprehensive monitoring of the current situation.
Forex trend indicator.
One of the most effective indicators currently available, the script's authors combined several popular trend indicators to improve the quality of its signals , significantly reducing the number of false signals. The Forex trend indicator signals trade openings and simultaneously indicates the preferred locations for placing stop-loss and take-profit orders. The signal itself is indicated by an arrow, and stop-loss orders are represented by multicolored stars.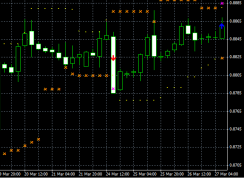
Trend oscillator.
The main difference between any technical analysis indicator and an oscillator is that the indicator simply analyzes the trend, while 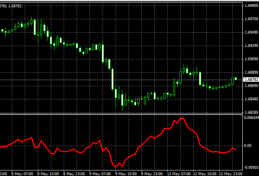 the oscillator also tries to predict further developments.
The trend oscillator lives up to its name: it attempts to predict the direction of a Forex trend.
It does this using a curved line displayed in a separate window below the currency pair chart. Additionally, a zero line is used during trading, serving as the primary reference point for opening trades.
Trend indicator.
An interesting script for determining trend direction allows you to automatically identify the direction of price movement 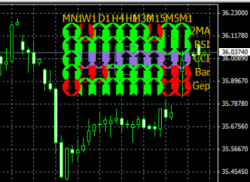 for a currency pair across all available time frames.
A trend indicator analyzes not only different timeframes but also uses various technical analysis methods.
It utilizes tools such as the RSI and CCI indicators, as well as a moving average. The trader also receives information about the trend direction on the last bar and any price gaps that have occurred.
Breakout indicator
A combined technical analysis indicator that allows you to plot support and resistance lines and simultaneously 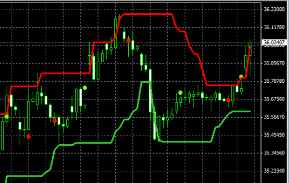 reports a possible breakout.
The breakout indicator is designed for use in trading strategies of the same name and is easy to set up and use in trading.
It's essentially an advisor for opening trades, but the orders themselves must be opened and closed manually.
The trading system is based on a price channel and placing orders at suggested breakout points.
Reversal indicator.
In Forex, there's nothing more important than knowing in advance about an impending reversal. This allows you to close a trade immediately, rather than waiting for 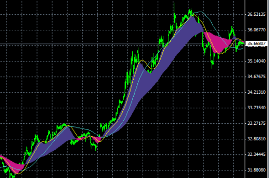 losses to reach your stop loss. This information can be obtained through fundamental or technical analysis.
In the latter case, it's best to use a special reversal indicator, which will warn the trader of an imminent trend change.
Reversal indicator - works on the basis of the MACD script, which has been significantly modernized and improved.
Flat indicator.
Most traders consider the flat market unsuitable for trading on the forex market, but it's precisely at this moment that 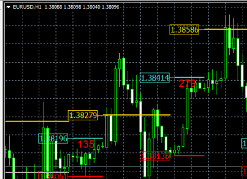 a guaranteed profit can be made. Trading can be done manually or using a special indicator.
The flat indicator is a type of channel indicator that captures flat market lows and highs and plots price levels based on them.
Once installed, the indicator plots several levels of different colors, which are designed to characterize the situation on different time frames.
Pivots Daily.
Another version of the well-known indicator, which is designed to calculate Pivot levels, the resulting graphic lines can 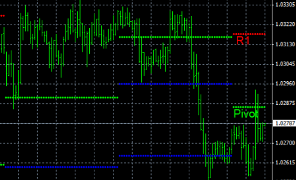 be used when conducting technical analysis of the Forex market.
Pivots Daily is based on a standard script with some operational improvements.
The convenience of this tool lies in its lack of numerous settings; after launching, you simply enter the number of bars to use in the calculations.
This allows for a quick launch, and the resulting Pivot levels will perfectly match your timeframe.
Dinapoli indicator.
Dinapoli levels are calculated using rather complex formulas, requiring a lot of data to perform the calculations. Therefore, 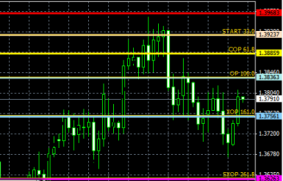 it would be more efficient to automate this process using a special script.
The DiNapoli indicator allows you to plot six levels, fully automatically. The downloadable instructions will help you fine-tune all the necessary parameters to suit your needs.
You'll also receive trade opening signals when switching between time frames and depending on market conditions.
Pivot points indicator.
If you want to simultaneously display several popular technical analysis levels on your trading terminal screen, this 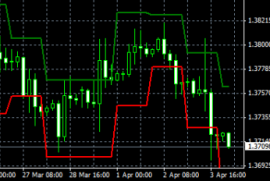 indicator is designed to solve this problem. The maximum timeframe for the indicator is H4, with no minimum timeframe limit.
The Pivot Points indicator plots the following levels: Fibonacci, DeMark, Camarilla, and Woodie. While it's true that sometimes the plotting doesn't follow the usual pattern, this only makes the tool even more interesting.
Each level serves as a benchmark, and depending on the trading strategy used, reaching its boundaries signals the opening of a new trade. The direction is determined by whether the price has reversed or broken through the level.
Fractals and price channel indicator.
Trading using fractals has long been a common practice among Forex traders. This method of technical analysis 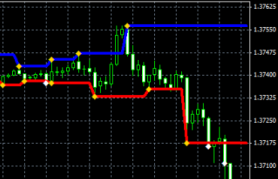 allows one to identify patterns in trend movements and find their most significant points.
The fractal indicator uses points identified through fractal analysis to construct price channels.
The initial impression of this tool is quite good, and it's immediately clear that it can be used for trading in many trading strategies.
Forex eye indicator.
One of the most popular indicators on the currency market, "Forex Eye" significantly simplifies the process of technical analysis, and therefore 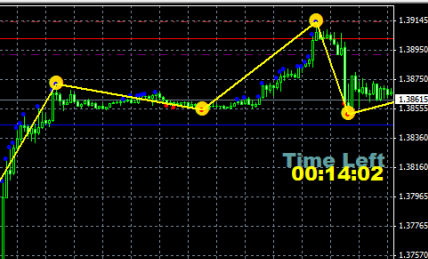 trading itself.
The Forex Eye indicator is a multifunctional tool that allows you to see indicators such as time frame time, trend direction on each individual candle, and the overall picture of the current trend.
The script not only calculates and plots levels but also provides trade recommendations, including sound alerts and email notifications.
Trend reversal indicator.
A fairly effective indicator that helps you spot a trend reversal in time, and close an existing position or, conversely, choose the best moment to 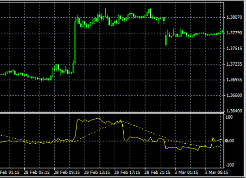 open a new order.
The trend reversal indicator uses a moving average when generating forecasts. Its operating principle is similar to the popular Moving Average, but it's a more advanced version.
Thanks to the changes, the indicator is now displayed in a separate window below the main currency pair chart, and its entire operation is based on three lines.
Pivot indicator.
A tool that allows you to automatically calculate pivot levels, or in other words, levels that, when reached, significantly increase 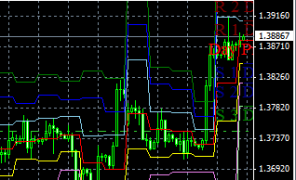 the likelihood of a price reversal.
The Pivot indicator adds 7 important levels to the chart of your selected currency pair, each with its own color for easier reading.
This tool is completely universal and can be used on any currency pair and time frame. The time of use is also irrelevant.
Pivot point indicator.
Pivot points have always been the most suitable places to enter the market; they are not easy to determine, so it is better 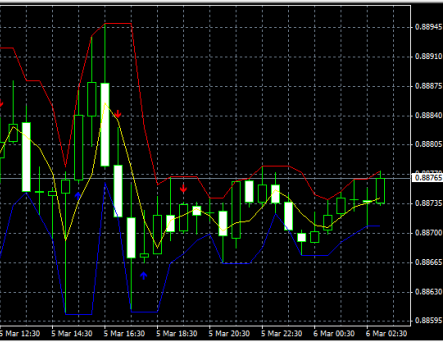 to use a special tool for these purposes.
The Pivot Points indicator is designed to identify price reversals. It captures both trend reversals and pullbacks, making it more effective.
In addition to trend reversal signals, the script draws three multi-colored lines on the chart, two of which act as support and resistance lines, and the third acts as a moving average.
Thanks to the variety of data available, using the Pivot Points indicator significantly expands your analysis capabilities. The chart clearly displays not only corrections and reversals, but also tracks the overall trend dynamics.
Moving Average multi.
This indicator uses moving average analysis to determine the current trend direction and its origins.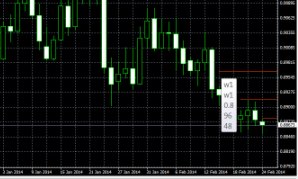
It works well across all timeframes and currency pairs, hence the "multi" prefix.
Unlike the standard Moving Average indicator, it doesn't display a single line, but instead displays multiple segments of different colors on the chart, characterizing the trend and its duration.
Working with this tool is quite simple; for maximum effectiveness, simply adjust the basic moving average parameters.
Price Alert indicator.
Trading using levels has always been one of the most effective strategies in 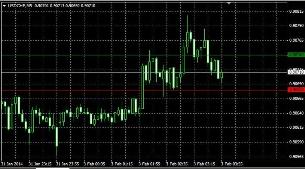 Forex trading. This is especially true if trades are opened after a breakout of an important level, as there's always a high probability of a trend continuation.
The Price Alert indicator isn't a fully-fledged indicator, as it doesn't perform any calculations or market analysis on its own. It's a simple script that sounds an alarm when the price reaches a specified point.
However, you'll have to find these points (levels) yourself. I'll provide a couple of recommendations on how to do this at the end of the article.
Camarilla indicator.
A simple indicator that doesn't require any additional settings, so traders of any skill level can use it 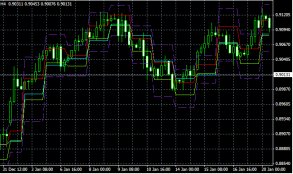
The Camarilla indicator is designed for reversal trading within daily time frames. It can also be used as a standard channel indicator.
Camarilla draws five multicolored lines, one of which is a trend line, while the others act as price channel boundaries. These lines are used to determine entry points.

