SpearmanRankCorr indicator
Today, there are dozens of different approaches to market analysis and thousands of indicators based on them.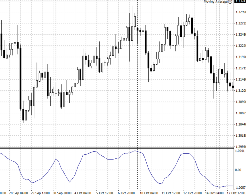
However, almost all technical indicators have one thing in common: they are based on statistics.
One way or another, when using any signal tool, we hope that the situation that previously occurred on the chart will repeat itself again.
Despite this, mathematical and statistical approaches are subject to unhealthy criticism from traders.
At the same time, almost no one disputes the graphical analysis (http://time-forex.com/tehanaliz/graf-analiz).
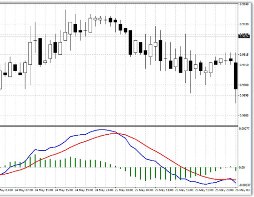
The SpearmanRankCorr indicator is a technical analysis tool based on complex mathematical calculations. The SpearmanRankCorr indicator is based on the Spearman rank correlation coefficient, which is implemented as a smoothed oscillator.
Spearman indicator
Traders who often criticize technical indicators and refuse to use them, pointing out that they are not based on an effective algorithm.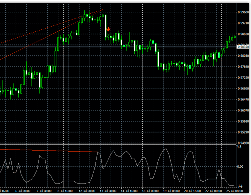
Also critics technical analysis They argue that indicators use historical prices in their calculations, so the signals will always be lagging.
The development of Forex trading has given rise to the creation of thousands of ridiculous tools that are quite colorful in appearance but offer no practical benefit, but not all indicators are as toothless as critics paint them.
For example, the Spearman indicator contains a complex mathematical formula that is designed to search for rank correlation.
Pattern Recognition Indicator
The use of candlestick patterns began long before the advent of online stock trading. The art of candlestick analysis in European and American markets emerged quite recently, and if it weren't for Steve Nison, who happened to come across a Japanese brochure, trading might still be conducted solely on linear charts.
However, with the advent of Japanese candlestick analysis, many traders' trading has been transformed, as, unlike indicator strategies, Japanese candlesticks provide signals that never lag.
This is due to the fact that the price is the main source of signals when Forex technical indicators they only make calculations based on it.
However, despite all the advantages of using candlestick analysis, there is one huge drawback - the subjectivity of the trader.
Unfortunately, traders tend to see things that are not really there, not to mention that in many cases, this or that figure is used incorrectly.
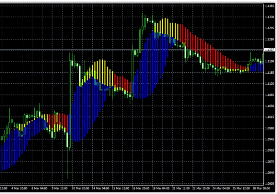
ZoneTrade indicator
Successful trading in financial markets requires a comprehensive analysis of assets. This often involves the use of various tools that can clearly determine the direction, strength, and acceleration of a trend.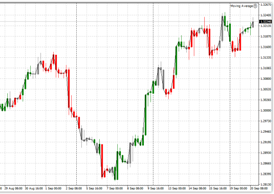
It is the integrated approach that provides clear signals, since determining the trend itself without a number of other parameters is practically useless.
For example, many of you have encountered a situation where, after buying a certain asset on a clearly defined upward trend, the price stagnates for several days, or even weeks, practically in place, resulting in swap losses.
This situation haunts most traders, since many other factors besides the direction of the forex market at the time of the signal were not taken into account.
The ZoneTrade indicator is a professional technical analysis tool that displays zones of an upward or downward trend directly on the chart, as well as those gray zones that are commonly called flat.
Truly News Indicator (auto trading)
Almost every trader who trades on the Forex market is somehow connected with the news and fundamental analysisThe fact is that news often acts as gasoline, causing prices to move, sometimes even inappropriately.
Therefore, any professional, no matter how much they oppose news trading, still checks the time and date of important statistics releases. Some take the released statistics into account, while others simply stop trading and close previously opened positions.
Traders who use various advisors based on mechanical trading strategies are particularly susceptible to the influence of news, as the price behaves erratically at the moment of news release, and the advisor can open a bunch of useless orders and enter into a trade with a wide spread, which naturally leads to losses.
There are different ways to follow the news. Typically, traders have to look at news from various information sources, broker pages.
FlatTrend indicator
Determining the current market state is the most important task for every practicing trader. It's no secret that the market can only exist in two phases: trending and flat.
A trending market is typically characterized by a clear, directional movement in a specific direction, either up or down. This is why, in professional circles, you often encounter terms such as a bullish trend (buyers push the price up) and a bearish trend (sellers push the price down).
The second market phase, known as "flat," is characterized by an uncertain price movement, which increasingly resembles a saw's teeth, scattering the price in different directions while maintaining a horizontal position.
All these phases of trend movement are equally important to a trader, as a long-term trend generates a flat because the market is running out of steam, and a flat generates a trend because players accumulate strength and capital, which begins to move the price with renewed vigor.
SMA indicator
The main problem when analyzing and forecasting any currency pair is the wave-like structure of the market, which has an unordered and chaotic movement in the form of various noises.

The increased noise in the Forex market makes the chart chaotic and unpredictable, rather than linear, as we see in various textbooks when analyzing various technical analysis patterns.
These zigzagging market waves make it difficult for even professionals, let alone novice traders, to clearly see trends.
Therefore, the golden rule of trading only with the trend is extremely difficult to implement in practice and is practically impossible to apply without additional trend indicators.
The SMA indicator is the most popular trend indicator, which began to be successfully used in the early 1960s and remains relevant today. If we decipher SMA, we get Simple Moving Average, which simply means simple moving average.
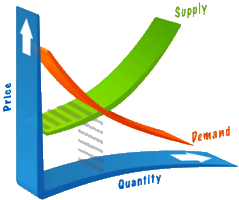
SupDem supply and demand indicator
Forex trading is essentially no different from the market relationships we see in a typical grocery market. On the forex exchange, as in a market, there are buyers and sellers, and prices are regulated by the balance between supply and demand.
In the forex market, as well as in the stock exchange, one simple law has always held true, and will always hold true: "Sellers try to sell high, and buyers try to buy low."
While in real life you browse several counters and find a reasonable price for a product, in the forex market you also try to buy the asset at a more favorable price in order to profit from its growth.
In fact, demand always meets supply, so if you divide all market players into sellers and buyers, you can quite accurately determine supply and demand zones—specifically, the prices at which sellers want to sell currency and buyers want to buy it.
The SupDem indicator highlights supply and demand zones on the chart, allowing you to analyze market participants' desires and potential price movements.
MACD Combo Indicator
It's no secret that visual perception of certain market processes greatly influences a trader's performance and productivity.
Often, beloved indicators, especially standard ones, have a rather complex signal recognition system.
This is why dozens, even hundreds, of different modifications of standard indicators can be found on various websites.
For example, traders don't want to watch moving averages, so they ask programmers to implement an indicator that displays the crossing moment with an arrow on the chart.
Hundreds of such modifications and adaptations are floating around on various Forex forums, and believe me, visualization really does make a difference to traders, helping them find the necessary signal much faster and easier.
Forex Profit Boost indicator
It's no secret that to achieve stable profits, traders have to abandon intuitive trading and opt for systematic trading using various trading strategies.
With the emergence of a huge number of strategies, traders resort to desperate and unreasonable measures to achieve uniqueness in their approach, increasing the number of indicators in their strategies and creating highly complex algorithms.
Unfortunately, in practice, such strategies always prove unprofitable, because the more complex the rules and conditions, the less frequently you receive signals, significantly impacting your trading performance.
The Forex Profit Boost indicator is a complex trend-following tool that combines two trend indicators.
Indicators like Forex Profit Boost are a classic example of how a single tool can become an excellent trading strategy without the need for excessive indicator overload. Moreover, the trading rules are so simple that even a beginner can master them.
The Time II VBO indicator is a trading session indicator
Trading sessions in the Forex market have a very significant impact on the activity of a currency pair, its strength and speed of movement.
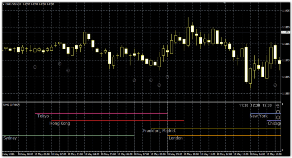
Many traders have unknowingly noticed how, at certain times each day, the market begins to slow down, enter sideways movement, or, conversely, make sharp leaps and break through certain levels.
Many attribute such phenomena to standard fundamental analysis, but currency activity, not its direction, is directly correlated with the trading session.
Trading sessions aren't simply a time range coined by market players; they are tied to global exchanges, which open and close at specific times.
Multicharts indicator
Working with a single instrument on the Forex market, namely one specific currency pair, greatly limits a trader's profitability.
For example, if you're a day trader and your strategy typically trades five times per currency pair , the time you spend waiting for the right opportunity to enter the market can be measured in hours, or even days. To improve their efficiency, most traders prefer to work on multiple currency pairs and stick to multi-currency trading. However, working with multiple currency pairs on a single monitor can be a real hassle.
VKW Bands – a new generation oscillator
In recent years, virtually all new products in the form of trading indicators, strategies, and advisors for the Forex market have become information products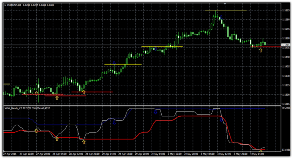 that are more profitable to sell to consumers than truly working trader tools.
That's why, when reading reviews of certain indicators, you increasingly come across a popular phrase that effectively kills the indicator: "it redraws."
Unfortunately, the automation niche is filled with shady salespeople who routinely scam people by selling various indicators whose signals suddenly disappear when the market goes in the wrong direction.
Ultimately, each trader decides for themselves whether to work with signals that redraw at their own risk or continue searching for something new and effective.
Scalper Dream indicator
Scalping techniques require traders not only to fully engage with the market and strictly adhere to all strategy rules, Money Management, 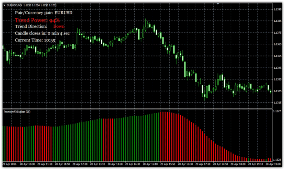 but also to use stable technical analysis tools that do not tend to change their readings during trading.
Of course, many argue that the key to success in scalping is being cool-headed when making decisions, as this can lead to dozens of losing trades a day, which can seriously damage your self-esteem.
However, in most cases, at the initial stage of choosing instruments, everyone makes a simply huge mistake, choosing oscillators that, to put it mildly, are only good in historical terms and redraw their indicators during trading.
In fact, for a scalper, the main enemy is instruments that repaint.
Ozymandias indicator
Almost every trader who approaches their trading more or less professionally knows one 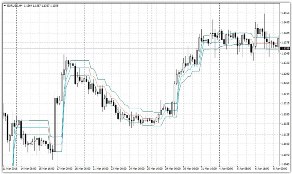 unbreakable rule: let profits run and cut losses quickly.
In fact, while the reluctance to use stop orders and nip unprofitable positions in the bud is more like stupidity, implementing the rule of letting profits grow is much more difficult.
Of course, if you take this rule literally, then there is nothing easier than opening a position and waiting a long time and relentlessly for the movement to work itself out.
However, we all know very well that the market never moves in a straight line and creates enormous market noise.
Breakout Indicator – Trade on a Breakout of the Overnight Flat
It's no secret to many traders that during the night, specifically during the Asian trading session, activity in major currency pairs 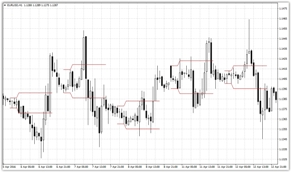 significantly decreases.
Firstly, this is due to the fact that in Europe and America it is night time, so the main investors do not conduct their trading.
Secondly, during the Asian trading session, the Japanese yen is more active due to the regional location of the exchange, while the dollar and euro fade into the background.
Thus, it is at night that we can observe a rather interesting picture, when the price moves in a narrow range, which, according to all technical analysis signs, resembles a flat.
BUY SELL MAGIC – a complex indicator with simple signals
Developing a trading strategy is one of the most painstaking processes every trader goes through.  The main problem is that in today's unpredictable markets, it's virtually impossible to use just one specific analysis tool.
That's why we encounter trading strategies online that are heavily loaded with various indicators and that solve specific problems.
In order to avoid additional overload and the creation of confusing and varied trading conditions, traders began combining several indicators into one large whole, which allowed them to cram complex trading strategies into a single arrow indicator.
The BUY SELL MAGIC indicator is a completely foreign product and is actively sold to this day on various trading platforms.
Wolfe Wave Indicator
Wave theory is considered one of the most complex techniques in graphical analysis. However, the popularity  of Elliott's works has given rise to new concepts and approaches to wave analysis, one of which is Wolfe's wave theory.
When analyzing waves, Wolfe applied the famous rule of physics, “For every action there is an equal and opposite reaction,” believing that the price swings back and forth like a pendulum.
By applying this rule, he formed his own concept of wave formation and offered the whole world his pattern, which consisted of five knees and showed a clear place of reversal and targets.
In fact, while graphical analysis and the main patterns of trend continuation and reversal are very subjective, the Wolfe pattern has clear rules for constructing and working with it.
BB MACD indicator
Creating your own trading strategy is in many ways like playing with a construction set, where each 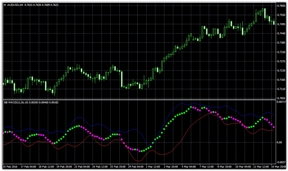 block has its own purpose, and the whole of them creates a complete structure.
By creating a strategy, you as a trader combine all the positive qualities of certain indicators and at the same time offset the negative ones, which will ultimately help you achieve your goals.
However, the vast majority of beginners begin, to put it mildly, to exaggerate the importance of having various indicators in a strategy, which is why we can see charts cluttered with dozens of necessary and unnecessary indicators.
This is especially noticeable when a trader tries to create a trading strategy from standard indicators, where, as a rule, 1 indicator is responsible for one direction.
The Ichimoku Indicator – A Master of Long-Term Trading
The Ichimoku indicator is a trend tool that was developed back in the 1960s by Japanese ![]() journalist Hosoda.
journalist Hosoda.
While working for the renowned Japanese stock market magazine Nikkei, Goichi Hosoda was constantly involved in market analysis, writing various educational articles and conducting analytical reviews of popular stock instruments.
After studying a ton of information, Hosoda decided to create his own technical analysis tool that would be capable of conducting long-term analysis.
As you can imagine, at that time the world was far from trading via personal computers, so Hosoda regularly hired students for practical training, who, roughly speaking, brought his idea to life with a pencil on a large piece of Whatman paper.
The ZigZag indicator is a master of trend detection
Market noise creates significant interference in determining the global trend. Many beginners 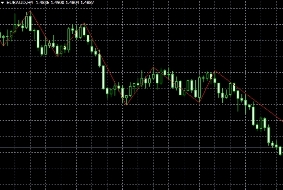 experience significant difficulty identifying trends, as the market's turbulent movements simply don't allow for a quick visual assessment of the global direction, with every trough or peak interpreted as a new trend direction.
Let's be honest, even seasoned traders often misjudge the direction of a trend during trading, as sharp, strong impulses against the main trend, which can amount to up to 50 percent of the current trend, can mislead even the most seasoned traders.
The ZigZag indicator is a so-called non-trading indicator, which aims to show the current market situation rather than provide specific signals for entering a position.
The peculiarity of the script is that it connects extreme extremes with lines, thus smoothing the price movement between selected local minimums and maximums.

